


randomwalk
-
Posts
23 -
Joined
-
Last visited
Content Type
Forums
Blogs
Gallery
Events
Learn About Weather and Meteorology
Community guides
Posts posted by randomwalk
-
-
circulation south of cornwall shows on radar and winds around cornwall. won't this enhance snow in southwest and weaken precipitation on front to east.
-
the gfs 0.5 shows about 30mm of precipitation falling sunday/tuesday at grid point near to brighton on the south coast. South Downs anyone?
-
follow the flow the atlantic gets in via gilbraltar, Italy, Germany, low countries and in the back door. What a devious play.
-
cold pool being throttled by warm air by monday, the pace of this is astounding
-
Look at the precipitation on the gfs approaching from the east; is this the upper trough that the meto/ecm has recently picked up.
-
I am looking for a reason to explain the difference in interpretation between the professionals and some of the leading lights on the forum.So these show extremely limited convection with a low level inversion and very dry air above. If these forecast tephis turn out to be correct there will be nothing but v light showers as JH for one, has also been pointing out for some time. Some of the other posters say that with a wind in this direction and with forecast wind speed and the forecast uppers they will be astonished if there is not significant snowfall in the south east. Some of these seem to be implying convection potency from the upper temp charts. Now I am sure that with identical pressure charts in the past there has been significant snow fall, but I am equally sure there are occasions that have been dry. The difference might be explained by the upper air profiles. If the 850s are very low but the 1000-500 thickness is just so-so then surely the 1000-850 thickness is not going to be that special; the really cold air is shallow. On the other hand if 850s were -6 and the 1000-500 thickness was slightly lower, the depth of the cold air would clearly be much greater.So to pass the tIme: here's a little exercise for those of you who expressed an interest in forecast profiles and how to use them wIthIn the forum here.... these two tephigram ascents are both for Friday AM. The BLACK one is E side of the Pennines... the RED one for SE England. I'll leave you to consider just what weather type can be expected from both at these locations.... have fun!
The former case is very cold dry weather as forecast; the latter is possibly one of those "i remember when 850s were only -5 and we had a foot of snow from showers/streamers etc occasions that some of us fondly remember"
To try and demonstrate the case it would be grate if someone could dig up a tephi ascent from one of those recent heavy easterly snowfall events, like the surrey/south eas t event of late november 2009 or 2010.
I've of course no idea whether the forecast tephigrams are correct or could be subject to change but must admit I'm intrigued by the concept of launching a balloon 4 days into the future and sending the results back to present!
regards to all
-
not as many times as we read that there will be snowfalls everywhere only to see it dry!!What people cant see in the UKMO 144 is the masses of energy over france that will lift to the UK.
Just give this a bl**dy chance, how many times do we read it will be dry only to see snowfalls everywhere.
The UKMo at 144 portrays another 2-4 Days at least with PPN moving NW off the continent. I think to be fair to the south & SW they havent had much snow this year- so good luck to them-
S
-
Sounds like a very good steer to me This logic seems to imply then that forecasting 500mb charts is easier/more reliable and hence less volatile than the surface pressure equivalents. Anomalies are presumably forecast heights compared to long term averages. Yourself and JH for example are clear advocates of this approach. Some of us, well me at least , would like to know why, i.e. what is it that makes it so much better. I would be grateful to hear your thoughts.Rule No 1 of chart watching in the internet age. Don't take any operational after 144 seriously no matter how good or bad it looks.
It might be a possble trend but thats about it.
Rule no 2 The 500 mb hieght anomily charts that JH bangs on about will give you a far better idea of how things might go in the longer term
than any operational output.
So no point talking about downgrades past 144 on a cold spell that hasn't even arrived yet and if you are going to comment then take a look the 500mb charts and you might be pleasantly surprised.
-
i.e ian if you were given a free hand you would side with with Steve Murr rather than the Met Office with their flawed models and in built biases towards what they see as the most likely outcomes?!?Hi Ian - Good to see the rationale-
My comment would be- Is it a level playing field-?
Is the MOGREPS resolution & handling of the baroclinic zone slightly weaker than the ECM OP-
I also heard you mention their default setting- which of course is west east-
It would be my assessment that all ensembles should be modified west towards the Raw as opposed to the other way round- as the ensembles- rather like the GFS are not resolving the track very well & are losing the signal for a westerly curving track as the model 'blueprint' takes over...
only my take--- & obviously UKMO will go with consensus- however if a pity you are a little restricted with your comments as I would hazard a guess given the choice you may sway towards the RAW as opposed to the MOGREPS ensemble suite....
S
-
doesn't a streamer need convection?
-
bbc forecast animation on the f/c just shown had a lot more significant white shading kent, london, just north and south of london in particular between 8pm and around 3 amlatest NAE
12pm rain
http://expert-images...021012_1006.gif
6pm mostly snow--- so probably a 2/3 hour transition once the rain sets in around 2pm
http://expert-images...021018_1006.gif
midnight snow for all east sussex in the sweet spot.
http://expert-images...021100_1006.gif
6am front moving north a tad- hopefully wont get quite that far
-
are you standing on your head?Im not 100% sure but it looks like sleety stuff here.. Bits of whatever is falling are going upwards - does drizzle do this? :-S
-
a slow burner this one in banstead, started light but has gradually increased in intensity, last hour fairly heavy around 7cm.
-
48 hour accumulated precip suggests a stalled front -man above is right
-
Hi Steve, why do we get that intensification of snowfall overnight fri/sat in the se? any theories?evening ALL- not sure if everyone read my post from this morning-
but my recommended chart was the T60 UKMO PPN - to see of there was any movement west of east of the front-
NOPE SMACK ON
http://www.meteociel...0-594.GIF?16-16
pivoting the same...
Also 2 points of note - again mentioned earlier-
* Removal of Snow to rain sunday- the updated UKMO 12z removes the rain threat from the region Sunday-
This will update on your apps & 5 day outlooks this eve ( as well as TV broadcasts)
* Mid term outlook & outlook to day 6 remains BITTER with more snow
sunday
... COLD DRY & temps around 0 to -3c MAXIMA
monday
... SNOW sliding across the capitol- esp the SW part
Tues
... More snow- winds in the Eastern quadrent so NO atlantic air becoming established--
a cracking eve so far....
S
-
i read mods as 'models' - if its modifications its different, but which is it?!i read it the other way the chief is sticking with his modification of the NAE as its out on its own , doesnt mean its not onto something , but currently has little support , we wont know really for another 24h
-
Ian has said the Chief is sticking with the NAE, suggest we look at that.....its completely different to the raw output isn't it?
-
Now snowing again Banstead, N Downs; moderate, temp has dropped a degree to 0. Think the warmest air may have passed
-
north downs near epsom, snowing for 1 1/2 hours with moderate bursts but despite being at 500 feet no significant settling, too much warmth mixed in i'm afraid.
-
light snow, North Downs near Epsom
-
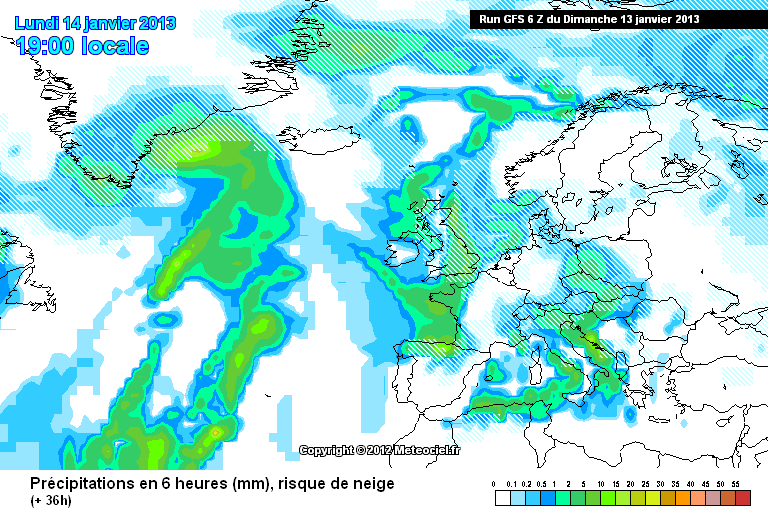
if you look at the 0.5 resolution it shows practically all rain in the south unfortunately -hopefully this is less reliable than the main model but that does seem counterintuitive?http://modeles.meteo.../gfs-2-36.png?6
back in the game


SE and East Anglia general weather discussion 07/11/2018
in Regional
Posted
euro 04 suggests that north downs will get 15-20 cm. and other places too. why no warning?