


kpm62
-
Posts
29 -
Joined
-
Last visited
Content Type
Forums
Blogs
Gallery
Events
Learn About Weather and Meteorology
Community guides
Posts posted by kpm62
-
-
Now thats what I call a snowfall! http://www.ecorazzi.com/2011/03/24/what-does-crazy-deep-snow-look-like/
-
Anyone snowed in yet?

-
-
http://uk.weather.co...London-UKXX0085 temperature slowly rising.
-
this will be the roads of uk tomorrow
-
For those that have taken a keen interest in this thread and also for completeness, here's the appraisal video to the Feb 2011 Storm forecast
I think thats a fair analysis.Like you state MB there were some accurate comparisons that no sceptic can deny.With regards to your future forecasts, have you seen any other extreme weather for the UK this winter?
-
Is there any info about this from a source other than Zangari? I'm not being funny but this story and accusations have been circulating for some time now but I haven't seen any other scientists confirming them. Surely if this were true or even a possibility it would have been investigated by others?
Pollution on that scale (and with such a high public profile) and the interruption of a major ocean current would not be ignored by the science community.
In subsequent interviews, Zangari expressed concern that CCAR began falsifying their satellite data following the publication of his paper. Gee, I wonder why they would falsify data? He added that unless the Loop Current reorganized itself, England would start experiencing Siberian-style winters and possibly another Ice Age.
Another effect of the breakdown of Thermohaline Circulation, according to Zangari, was a disruption in the atmospheric Jet Stream in summer 2010, causing unheard of high temperatures in Moscow (104F) and drought, and flooding in Central Europe, with high temperatures in much of Asia and massive flooding in China, Pakistan, and elsewhere in Asia.
I don’t pretend to understand the advanced calculus Zangari employed to formulate his findings. However now that his predictions have come to pass, I think he needs to be taken seriously.
-
Sorry, i may have missed something, but you don't appear to have answered my question about evidence. Do you have a source for these claims? They are quite extraordinary. But even if they did find one 3 miles wide, and a bigger one off Florida, assuming that is as little at 5% of the undersea oil ( Which I doubt; if they have had this long, with modern technology and the extent of the research any external agency probably would've found most of the larger plumes by now) then that is still only a miniscule portion of the Gulf. The quote from Tony Hayward doesn't mean anything. There was oil on the surface, and by the laws of physics most of the oil would have gone straight for the surface.
These are not my findings they are those of Professor Zangari and his team of scientists,which have given rise to extensive discussion in the scientific community
The accurate figure of the gulf oil spill is a matter of conjecture,but for the period of the leak millions upon millions of gallons of crude oil was released from that fracture. Based on the satellite traces that have been carried out and the extensive testing on water samples along the coastal regions and out in the deep sea , the evidence indicates a substantial contamination .
Zangari is a Theoretical Physicist at the Ascati Institute in Italy. He has worked for years with a collaborative network of scientists monitoring the Gulf of Mexico Loop Current and its contribution to the Thermohaline Current System that makes the Gulf Stream that becomes the North Atlantic Drift Current.In June Zangari published a paper based on CCAR Colorado, NOAA and US Naval satellite data revealing the Ocean Conveyor Belt had stopped a month earlier, breaking into small eddies 250 miles from the Outer Banks of North Carolina. Zangari blamed this on the millions of gallons of Corexit BP dumped into the Gulf. This combined with oil to form a sludge that sunk to the ocean floor that gradually spread via ocean currents along the US Atlantic coast.
“As displayed by both by the sea surface maps and the sea surface height maps, the Loop Current broke down for the first time around May 18th and generated a clock wise eddy, which is still active. As of today the situation has deteriorated up to the point in which the eddy has detached itself completely from the main stream therefore destroying completely the Loop Current. ..â€
“It is reasonable to foresee the threat that the breaking of [such] a crucial warm stream as the Loop Current may generate a chain reaction of unpredictable critical phenomena and instabilities due to strong non-linearities which may have serious consequences on the dynamics of the Gulf Stream thermoregulation activity of the Global Climate.†—Dr. Gianluigi Zangari,
-
Thanks very much for your post, it is very informative. But I think there is a couple of assumptions in there, could you clear these up for me?
Surely it is wrong to say about half the gulf floor is covered. There are several reasons for this. The main one being that you have contradicted yourself, you say the government hid the scale of the disaster, yet you can give this measurement? Also, for the time the oil was leaking there couldn't possibly have been enough in total to cover the sea floor, considering almost all the oil would have formed a slick on the surface anyway. Only a small percentage ( Possibly heavier fractions/ carbon chains?) would have sunk. Also you see the oil is up the coast of USA, can i see the source? I also believed that as oil traveled that distance it would disperse and would become very diluted.
thanks
From the legal point of view BP will be fined based on the amount of oil that leaks.
The official answer to how big the leak is keeps getting put off reports CBS News investigative correspondent Sharyl Attkisson. For the first time, BP gave high resolution video to scientists trying to figure it out, but it's still holding back other material.
"Our estimate should be independent of BP," says Purdue University professor Steve Wereley. "We should take them out of the process."
Senators fired off a letter telling BP it "must not hinder" or "undermine(d)" a "truly independent" estimate.
Meantime, there's mistrust over another issue: oil lingering unseen beneath the surface.
It's marine scientists from gulf state universities - not the government or BP - who have been flagging giant undersea plumes for weeks. University of Georgia researchers found one three miles wide.
The University of South Florida found an even bigger one.
But BP, responsible for managing the fall-out, appears to be in a perpetual state of denial. They insist all the oil is on top.
"The oil is on the surface," said BP CEO Tony Hayward on May 30.
BP COO Doug Suttles echoed that sentiment to CBS News Early Show anchor Harry Smith Wednesday. Asked directly by Smith if he believed the underwater plumes existed, Suttles said, "Harry, no one has found any large concentrations of oil beneath the surface."
Smith responded, "So scientists are making it up?"
"All we can know for certain is what we measured," said Suttles.
Environmentalist Philippe Cousteau says, "I think it's irresponsible for them to be denying that."
-
Doing a bit more research, the Katla caldera is apparently approximately 10*14 kms, presumably some sort of ovoid, and the ice sheet is about 700 metres thick. Drawing a pretty loose bow around this, this could easily represent 50-80 cu. kms of ice.
Eyjafjallaj�kull has now developed a new magma fissure, and if I was a gambling type I would say that the chances of Katla joining in were increasing.
The key question seems to be: would 50 cubic kms of fresh water dumped into the surface layer of the North Atlantic around Iceland very quickly be enough to reduce its density sufficiently to force the North Atlantic Drift to "dive" to abyssal depths much earlier than normal?
If I was a European meteorologist, this is something I would be investigating with considerable interest.
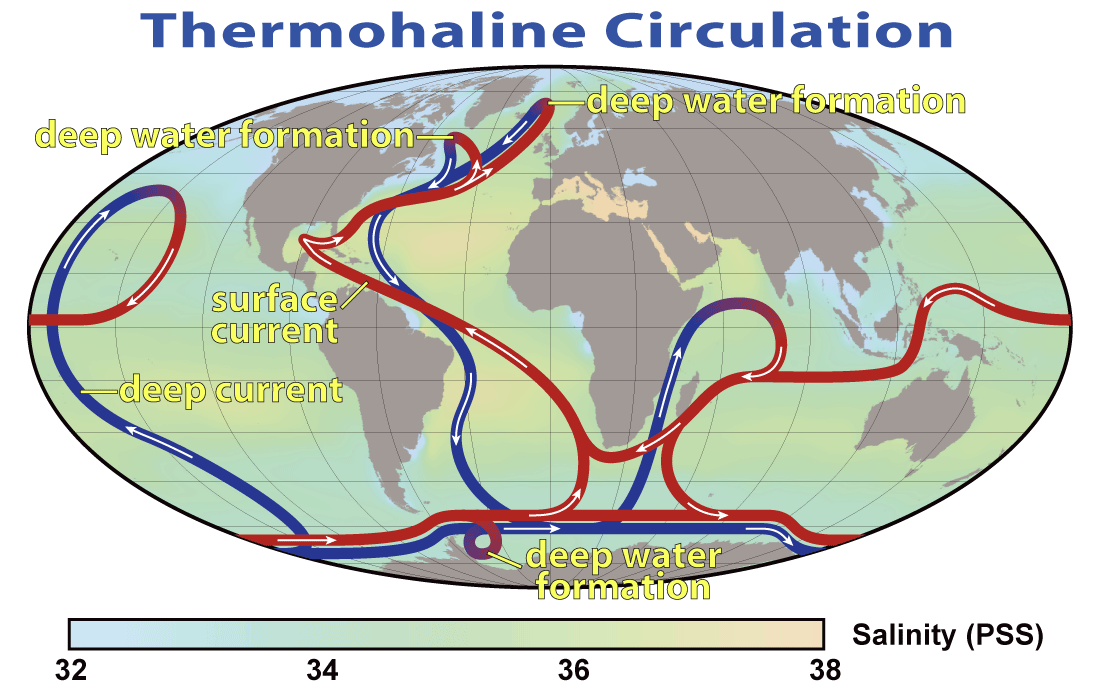
The latest satellite data establishes that the North Atlantic Current (also called the North Atlantic Drift) no longer exists and along with it the Norway Current. These two warm water currents are actually part of the same system that has several names depending on where in the Atlantic Ocean it is. The entire system is a key part of the planet’s heat regulatory system; it is what keeps Ireland and the United Kingdom mostly ice free and the Scandinavia countries from being too cold; it is what keeps the entire world from another Ice Age. This Thermohaline Circulation System is now dead in places and dying in others.
This ‘river’ of warm water that moves through the Atlantic Ocean is called, in various places, the South Atlantic Current, the North Brazil Current, the Caribbean Current, the Yucatan Current, the Loop Current, the Florida Current, the Gulf Stream, the North Atlantic Current (or North Atlantic Drift) and the Norway Current.
The thermohaline circulation is sometimes called the ocean conveyor belt, the great ocean conveyor, or the global conveyor belt.
It is a university level physics experiment to use a tub of cool water and inject a colored stream of warm water into it. You can see the boundary layers of the warm water stream. If you add oil to the tub it breaks down the boundary layers of the warm water stream and effectively destroys the current vorticity . This is what is happening in the Gulf of Mexico and in the Atlantic Ocean.
The entire ‘river of warm water’ that flows from the Caribbean to the edges of Western Europe is dying due to the Corexit that the Obama Administration allowed BP to use to hide the scale of the BP Deepwater Horizon Oil Disaster. The approximately two million gallons of Corexit, plus several million gallons of other dispersants, have caused the over two hundred million gallons of crude oil, that has gushed for months from the BP wellhead and nearby sites, to mostly sink to the bottom of the ocean. This has helped to effectively hide much of the oil, with the hopes that BP can seriously reduce the mandated federal fines from the oil disaster. However, there is no current way to effectively ‘clean up’ the bottom of the Gulf of Mexico, which is about half covered in crude oil. Additionally, the oil has flowed up the East Coast of America and into the North Atlantic Ocean, and there is no way to effectively clean up this ‘sea bottom oil’. It is likely, based on numerous reports, that the oil is still flowing in massive amounts from multiple places on the seabed floor. This effectively means, that even if we had the technology in place to somehow clean up the free flowing thick crude oil deep in the ocean, it would likely not be enough to reverse the damage to the Thermohaline Circulation System in the Atlantic Ocean.
Dr. Deagle: The evidence has come in from ROV video and other experts such as Matt Simmons, BK Lim, and Lindsay Williams and my own anonymous whistleblowers from inside the closed circle of Cameron Ironworks, Tranocean Marine , Oceaneering International. My source provided very solid info re the ROV analysis by Oceaneering engineers that the BOP Blow Out Preventer was ‘modified’ and never had hydraulics to close the BOP. BP knew that the field had dangerous high levels of methane, hydrogen sulphide, and pressures exceeded any valve technology as the current state of the art. The seeps continue along a fractured fault line from the Macondo well site where evidence presented by BK Lim that the only well of three that reached the abiotic batholith ocean of oil and gas was never capped or stopped and has continued to leak along the ocean floor and inject oil and gas and tar into the rock strata.
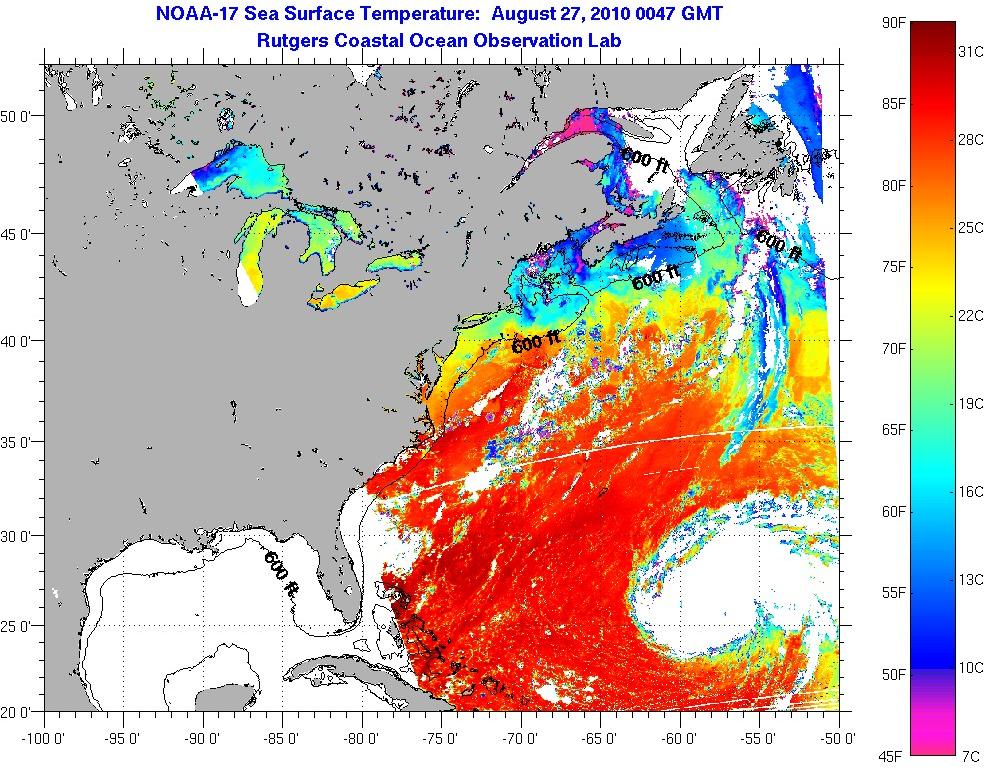
Dr Gianluigi Zangari PhD from the Frascati Institute is a Theoretical Physicist, who has worked for years with a collaborative network of scientists monitoring the Gulf of Mexico Loop Current and its contribution to the Thermohaline Current System that makes the Gulf Stream that becomes the North Atlantic Drift Current and subcurrents. After receiving a contact from a naval scientist via a regular guest on the NutriMedical Report national radio show, on Genesis Network, John Moore sent Dr. Deagle the info on Dr Zangari’s work. Dr. Deagle contacted him by SKYPE and and within minutes was conversing by SKYPE to Italy with Dr Zangari re his serious analysis with data from six satellites of the May to June 12th 2010 dissolution of the Loop Current. Over the next few weeks to July 28th, with numerous interviews on The NutriMedical Report and LiveStream.com/TheNutriMedicalReportShow updates, final proof was provided that the Gulf Stream had been stopped cold at the 47th longitudinal parallel with a 10 degree Celsius ocean temperature drop, and loss of velocity and energy, so that the Gulf Stream was only able to be measured by satellite to less than one-third the way across the Atlantic ocean. As Dr Zangari stated, this is not the butterfly effect but the ‘elephant effect’, and with the amount of oil released, the natural system linked as the pacemaker to world climate for millions of years, this was now gone, replaced by an artificial system with a Gulf of Mexico by late July seven degrees Celsius above normals, and totally disconnected Loop Current from the Florida current that becomes the Gulf Stream. In his reported on June 12th 2010 in a journal article, the CCAR Colorado data agreed with the NOAA and US Naval Satellites data. This live satellite data map later altered on the CCAR servers, and he emailed that this was “to falsify†and he could not explain this fact logically. He returned to NOAA and US Naval data on the same and later dates and stated by early August that the CCAR data was no longer reliable and his conclusions was not changed in quality or quantity of the serious consequences. His conclusion that ‘glaciation’ at an unknown pace was inevitable from this disaster.
Almost a month ago, we broke the story that the Loop Current in the Gulf of Mexico had effectively died. We quoted Dr. Gianluizi Zangari, who first discovered the damage to the Thermohaline Circulation System:
“As displayed by both by the sea surface maps and the sea surface height maps, the Loop Current broke down for the first time around May 18th and generated a clock wise eddy, which is still active. As of today the situation has deteriorated up to the point in which the eddy has detached itself completely from the main stream therefore destroying completely the Loop Current. ..â€â€œIt is reasonable to foresee the threat that the breaking of [such] a crucial warm stream as the Loop Current may generate a chain reaction of unpredictable critical phenomena and instabilities due to strong non-linearities which may have serious consequences on the dynamics of the Gulf Stream thermoregulation activity of the Global Climate.â€- Dr. Gianluigi ZangariThe massive amount of crude oil, ever expanding in volume and covering such an enormous area, has seriously affected the entire thermoregulation system of the planet, by breaking up the boundary layers of the warm water flow. The Loop Current in the Gulf of Mexico ceased to exist a month ago, the latest satellite data clearly shows that the North Atlantic Current is now GONE and the Gulf Stream begins to break apart approximately 250 miles from the Outer Banks of North Carolina. The Thermohaline Circulatory System, where the warm water current flows through a much cooler, much larger, ocean, effects the upper atmosphere above the current as much as seven miles high. The lack of this normal effect in the eastern North Atlantic has disrupted the normal flow of the atmospheric Jet Stream this summer, causing unheard of high temperatures in Moscow (104F) and drought, and flooding in Central Europe, with high temperatures in much of Asia and massive flooding in China, Pakistan, and elsewhere in Asia.
A Normal Gulf Stream taken from 5 September2004.
Figure 1. Gulf Stream velocities one week ago: Sunday 22 August 2010
Figure 2. Gulf Stream velocities two weeks ago: Sunday 15 August 2010
Figure 3. Gulf Stream velocities three weeks ago: Sunday 8 August 2010
Figure 4. Gulf Stream velocities four weeks ago: Sunday 1 August 2010
Older data charts:
Figure 1. Gulf Stream velocities one week ago: Wednesday 18 August 2010
Figure 2. Gulf Stream velocities two weeks ago: Wednesday 11 August 2010
Figure 3. Gulf Stream velocities three weeks ago: Wednesday 4 August 2010
Figure 4. Gulf Stream velocities four weeks ago: Wednesday 28 July 2010
The most current data continues to show a dying of the entire Thermohaline Circulation System in the Atlantic Ocean. This is indicative of the fact that the dispersants have caused the oil to remain in place below the surface, and according to most reports remain in almost full amounts (up to 80%) long after the BP Oil Disaster began. Since there is no current way to remove this massive amount of free flowing oil below the sea at depths up to one mile deep, it is apt to continue to effect any natural recovery of the Thermohaline Circulation System.
So what does this mean? Violent mixing of the seasons, crop failures, and increased drought and floods in diverse places is now daily news since the April 20th 2010 BP Oil Volcano. They have killed the pacemaker of world climate in the worlds of Dr Zangari PhD. Dr Mike Coffman PhD geologist resource climatologist, and Dr Tim Ball PhD climatologist have confirmed that if this data is correct, that an ice age and massive climate shift with famine is now imminent. We are now seeing Russia stop all delivery of wheat crops on prior contracts, and most sources of staple food crops moving worldwide in a crisis of famine. The Gulf Stream and related currents are effectively DEAD. This should enrage the public and bring forth scientists to challenge and support the data and analysis, for the consequences to the civilization of mankind and ecological collapse have global consequence producing famine, death and massive population migration away from zones of advancing ice age and regions unfit for human habitation. Let us get the facts and call the corporate and government to task on these issues now or face worldwide catechisms of biblical proportions. We shall continue to report with new scientific experts on this most important disaster.
The ‘process’ of entering a new Ice Age could begin coming upon us in full force (rather like in the movie “The Day After Tomorrowâ€) at any time, or it could take three to five year to fully play out with early glaciation beginning in North America and Europe and Asia this winter (both models have existed in the beginnings of different Ice Ages in Earth’s past).
Current sea surface temperature satellite data show pre-Ice Age cooling continuing – image ~
A new Ice Age, could kill 2/3 of the human race in the first year in a rapid onset; a slower onset would likely kill close to this number but simply take a handful of years.! Thank you BP; thank you President Obama, the lies and the dispersants were just great. Now if you could just direct all that hot air to the right places maybe we can avoid a icy hell in our near future.
UPDATE 2 September 2010: Europe is going into an early winter ~ link ~ with snowfall in the Alps coming a month early ~ link ~ half a meter of snow in late August in Norway ~ link ~ early snow in Russia ~ link ~ Additionally, sea ice in the Antarctic is at near record levels ~ link ~ and coldest August in South Australia in 35 years ~ link ~ This is indicative of a major climatic change to the entire planet and is to be expected from the dying Thermohaline Circulation System in the Atlantic Ocean
-
A Chilling Possibility
By disturbing a massive ocean current, melting Arctic sea ice might trigger colder weather in Europe and North America
March 5, 2004: Global warming could plunge North America and Western Europe into a deep freeze, possibly within only a few decades.
That's the scenario gaining credibility among many climate scientists. The thawing of sea ice covering the Arctic could disturb or even halt large currents in the Atlantic Ocean. Without the vast heat that these ocean currents deliver--comparable to the power generation of a million nuclear power plants--Europe's average temperature would likely drop 5 to 10°C (9 to 18°F), and parts of eastern North America would be chilled somewhat less. Such a dip in temperature would be similar to global average temperatures toward the end of the last ice age roughly 20,000 years ago.
Some scientists believe this shift in ocean currents could come surprisingly soon--within as little as 20 years, according to Robert Gagosian, president and director of the Woods Hole Oceanographic Institution. Others doubt it will happen at all. Even so, the Pentagon is taking notice. Andrew Marshall, a veteran Defense Department planner, recently released an unclassified report detailing how a shift in ocean currents in the near future could compromise national security.
"It's difficult to predict what will happen," cautions Donald Cavalieri, a senior scientist at NASA's Goddard Space Flight Center, "because the Arctic and North Atlantic are very complex systems with many interactions between the land, the sea, and the atmosphere. But the facts do suggest that the changes we're seeing in the Arctic could potentially affect currents that warm Western Europe, and that's gotten a lot of people concerned."
Ice is Key
There are several satellites keeping an all-weather watch on ice cover in the Arctic. NASA's Aqua satellite, for instance, carries a Japanese-built sensor called the Advanced Microwave Scanning Radiometer-EOS ("AMSR-E" for short). Using microwaves, rather than visible light, AMSR-E can penetrate clouds and offer uninterrupted surveillance of the ice, even at night, explains Roy Spencer, the instrument's principal investigator at the Global Hydrology and Climate Center in Huntsville, Alabama. Other ice-watching satellites, operated by NASA, NOAA and the Dept. of Defense, use similar technology. The view from orbit clearly shows a long-term decline in the "perennial" Arctic sea ice (the part that remains frozen during the warm summer months). According to a 2002 paper by Josefino Comiso, a climate scientist at NASA's Goddard Space Flight Center, this year-round ice has been retreating since the beginning of the satellite record in 1978 at an average rate of 9% per decade. Studies looking at more recent data peg the rate at 14% per decade, suggesting that the decline of Arctic sea ice is accelerating.
Some scientists worry that melting Arctic sea ice will dump enough freshwater into the North Atlantic to interfere with sea currents. Some freshwater would come from the ice-melt itself, but the main contributor would be increased rain and snow in the region. Retreating ice cover exposes more of the ocean surface, allowing more moisture to evaporate into the atmosphere and leading to more precipitation.
Because saltwater is denser and heavier than freshwater, this "freshening" of the North Atlantic would make the surface layers more buoyant. That's a problem because the surface water needs to sink to drive a primary ocean circulation pattern known as the "Great Ocean Conveyor." Sunken water flows south along the ocean floor toward the equator, while warm surface waters from tropical latitudes flow north to replace the water that sank, thus keeping the Conveyor slowly chugging along. An increase in freshwater could prevent this sinking of North Atlantic surface waters, slowing or stopping this circulation.
AMSR-E is collecting new data that will help scientists evaluate this possibility. For one thing, it provides greatly improved ground resolution over previous all-weather sensors. AMSR-E images reveal smaller cracks and fissures in the ice as it breaks up in the spring. This detail allows scientists to better understand the dynamics of ice break-up, says Cavalieri, a member of the AMSR-E team.
.
"Other important pieces of the puzzle, like rainfall, sea-surface temperatures, and oceanic winds, are also detected by AMSR-E. Looking at those variables together should help scientists assess the likelihood of a change in the Atlantic currents," adds Spencer.
Deja Vu?
Once considered incredible, the notion that climate can change rapidly is becoming respectable. In a 2003 report, Robert Gagosian cites "rapidly advancing evidence [from, e.g., tree rings and ice cores] that Earth's climate has shifted abruptly and dramatically in the past." For example, as the world warmed at the end of the last ice age about 13,000 years ago, melting ice sheets appear to have triggered a sudden halt in the Conveyor, throwing the world back into a 1,300 year period of ice-age-like conditions called the "Younger Dryas."
Will it happen again? Researchers are scrambling to find out.
On Feb. 13, an expedition set sail from Great Britain to place current-monitoring sensors in the Atlantic Ocean that will check the Gulf Stream for signs of slowing. The voyage is the latest step in a joint US / UK research project called Rapid Climate Change, which began in 2001. Another international project, called SEARCH (Study of Environmental Arctic CHange), kicked off in 2001 with the goal of more carefully assessing changes in Arctic sea ice thickness.
Much depends on how fast the warming of the Arctic occurs, according to computer simulations by Thomas F. Stocker and Andreas Schmittner of the University of Bern. In their models, a faster warming could shut down the major Atlantic current completely, while a slower warming might only slow the current for a few centuries.
And, inevitably, the discussion turns to people. Does human industry play a major role in warming the Arctic? Could we reverse the trend, if we wanted to? Not all scientists agree. Some argue that the changes occuring in the Arctic are consistent with large, slow natural cycles in ocean behavior that are known to science. Others see a greater human component.
"The sea ice thawing is consistent with the warming we've seen in the last century," notes Spencer, but "we don't know how much of that warming is a natural climate fluctuation and what portion is due to manmade greenhouse gases."
If the Great Conveyor Belt suddenly stops, the cause might not matter. Europeans will have other things on their minds--like how to grow crops in snow. Now is the time to find out, while it's merely a chilling possibility.
-
Well, here's a silly question! Would the quantity of ice being melted by the Icelandic volcano (the name of which is somewhat beyond my spelling ability
) have any effect whatsoever on the Gulf Stream, or is it just a drop in the ocean? (pun not really intended!)What about if the bigger volcano went up (Katlya
) and melted even more ice....would that have any effect?That's two silly questions then!
Doing a bit more research, the Katla caldera is apparently approximately 10*14 kms, presumably some sort of ovoid, and the ice sheet is about 700 metres thick. Drawing a pretty loose bow around this, this could easily represent 50-80 cu. kms of ice.
Eyjafjallajökull has now developed a new magma fissure, and if I was a gambling type I would say that the chances of Katla joining in were increasing.
The key question seems to be: would 50 cubic kms of fresh water dumped into the surface layer of the North Atlantic around Iceland very quickly be enough to reduce its density sufficiently to force the North Atlantic Drift to "dive" to abyssal depths much earlier than normal?
If I was a European meteorologist, this is something I would be investigating with considerable interest.
-
I think its just a way the planet regulates its temp.
The hotter the planet the more ice melts..
The melted "non saline" water drifts south , This effectivly stops the conveyor from sinking and returning south.
This on its own would slow it down and cause cooling in the north.
HOWEVER!
The cooling would then increase sea ice and icepack and lower the amount of fresh water draining into the oceans.
NOT just this, But the extra ice cover would also reflect UV rays and heat back up, Also increasing the cooling.
This would then encourange the conveyor to move north again and increase speed.
This would then push the icepacks further north over time and warming the NE up again.
Rinse repeat.
In early 2010 U.S. scientists published new findings that showed the current was prone to short term variability but that there was no long term decline. Though the mechanisms dictating the short term changes are still poorly understood, changes in the current are believed to be part of a natural cycle,so there may be some logic in your reasoning.
The results are not entirely conclusive however. The scientists believe that their system is good enough to detect long term changes in flow of around 20%; however, the volumes of water involved are massive – up to 35 million tonnes of water a second – and accurate sensing equipment across the Atlantic has only been available for a relatively short period of time.
The large variability in seasonal and annual flows also make it difficult to provide a conclusive long term projection. The scientists are, however, actively working to get a better understanding of the phenomena and it is hoped that their research will inform future predictions of climate change hazards.
The Gulf Stream is a feature of Western European climate that has a great warming effect on Western European nations, particularly during the winter and in the north. If the Gulf Stream were to slow down or sink entirely it may lead to a drop in temperature across Western Europe. Scientists have previously predicted that global warming could produce such a slow down but recent studies have shown that this may not be the case. However, the studies are still inconclusive and it is likely that the real mechanisms governing the flow of the Gulf Stream will not be understood for a long time.
-
Make you right there.
If I'm honest, I'd love just one whole month per Winter of just cold, with regular snowfall but also lovely crispy sunny days with no melt, like on the Alps when you go skiing, Christmas eve to-24th Jan be ideal, then a slow warm up. Am I asking for too much, surely not?
Ah right, thanks for that. Well if you have some decent altitude I think you will do ok even in the coming week.
I think thats a case of wishful thinking.The latest models for the SE show a gradual increase of temperatures over the coming week,which is backed up by BBC weather online.That E block of cold air just does not want to move any further our way.In fact it will start to retract next week from across Europe reducing the upper atmosphere temps in the process,bringing a thaw to their snowfields.Having said the weather dynamics take on a new slant from the end of next week with cold air moving down from the N with LP,which could bring Scotland alot of snow and the rest of us to follow afterwards.But as we all know a week is a long time in weather forecasting,especially of late,where we have seen such a variation in the model runs from one day to the next,so we will have to wait and see what transpires.
-
Scientists have uncovered more evidence of a dramatic weakening in the vast ocean current that gives Western Europe its relatively balmy climate by dragging warm water northwards from the tropics.
The slowdown of the North Atlantic Drift, which climate modellers have predicted will follow global warming, has been confirmed by the most detailed study yet of ocean flow in the Atlantic.
Most alarmingly, the data reveals part of the current, usually 60 times more powerful than the Amazon River, came to a temporary halt during November 2004.
The nightmare scenario of a shutdown in the meridional ocean current that drives the Gulf Stream was dramatically portrayed in disaster film The Day After Tomorrow.
That scenario had Europe and North America plunged into a new ice age virtually overnight. Although no scientist thinks the switch-off could happen that fast, they do agree that even a weakening over a few decades would have profound consequences.
The Gulf Stream originates in the Gulf of Mexico, flows up the US east coast, then crosses the Atlantic, where it splits in two, with one branch crossing to West Africa. The other branch, the North Atlantic Drift, extends towards Europe. The warm water it brings to Western Europe's shores raises the temperature by as much as 10 degrees in some places and without it the continent would be much colder and drier.
Researchers are unsure what to make of the 10-day hiatus in the current in 2004.
"We'd never seen anything like that before and we don't understand it. We didn't know it could happen," said Harry Bryden, of Britain's National Oceanography Centre, who presented the findings to a conference in Birmingham on rapid climate change.
Is it the first sign that the current is stuttering to a halt?
"I want to know more before I say that," Professor Bryden said.
Lloyd Keigwin, of the Woods Hole Oceanographic Institution in the US, said the 2004 shutdown was "the most abrupt change in the whole [climate] record". "Suppose it lasted 30 or 60 days, when do you ring up the prime minister and say let's start stockpiling fuel? … How can we rule out a longer one next year?" he said.
Professor Bryden's group stunned climate researchers last year with data suggesting that the flow rate of the Atlantic circulation had dropped by about 6 million tonnes of water a second from 1957 to 1998.
If the current remained that weak, he predicted, it would lead to a one-degree drop in temperature in Britain in the next decade. A complete shutdown would lead to a four- to six-degree cooling over 20 years.
What future climate scenarios should we consider?
The debate on global change has largely failed to factor in the inherently chaotic, sensitively balanced, and threshold-laden nature of Earth’s climate system and the increased likelihood of abrupt climate change. Our current speculations about future climate and its impacts have focused on the Intergovernmental Panel on Climate Change, which has forecast gradual global warming of 1.4° to 5.8° Celsius over the next century.
It is prudent to superimpose on this forecast the potential for abrupt climate change induced by thermohaline shutdown. Such a change could cool down selective areas of the globe by 3° to 5° Celsius, while simultaneously causing drought in many parts of the world. These climate changes would occur quickly, even as other regions continue to warm slowly. It is critical to consider the economic and political ramifications of this geographically selective climate change. Specifically, the region most affected by a shutdown—the countries bordering the North Atlantic—is also one of the world’s most developed.
The key component of this analysis is when a shutdown of the Conveyor occurs. Two scenarios are useful to contemplate:
Scenario 1: Conveyor slows down within next two decades.
Such a scenario could quickly and markedly cool the North Atlantic region, causing disruptions in global economic activity. These disruptions may be exacerbated because the climate changes occur in a direction opposite to what is commonly expected, and they occur at a pace that makes adaptation difficult.
Scenario 2: Conveyor slows down a century from now.
In such a scenario, cooling of the North Atlantic region may partially or totally offset the major effects of global warming in this region. Thus, the climate of the North Atlantic region may rapidly return to one that more resembles today’s—even as other parts of the world, particularly less-developed regions, experience the unmitigated brunt of global warming. If the Conveyor subsequently turns on again, the “deferred” warming may be delivered in a decade.
-
It's been like this here in Laindon all morning,just intermittent snow showers,nothing to get excited about.Be nice to experience ,one of those ,once in a lifetime snowstorms WASHINGTON has just experienced.Looking at the weather maps and models for the next week or so we'll be lucky to get an inch.Can anyone else see anything positive in those models?
-
That is interesting,looks like that could dump a fair load of snow,if that cold air is with us by then.
-
Some fantastic model output this morning. I have to admit over recent days I haven't been happy with the trend of the ECM for the +96/+144 period but thankfully this morning that downward trend has been replaced with a run that has far more potential. The UKMO is disappointing but looking at all the models I would say the ECM at +96 is a fair reflection of what many are suggesting.
http://www.wetterzen...ics/Recm961.gif
So based on this my summary remains similiar to last night. From midweek snow showers moving into E areas these becoming more widespread and frequent as the week progresses. The only difference I will say this morning compared to last night is during Fri/Sat the snow could move well inland to affect many regions and the showers might be replaced with more prolonged spells of snow.
Moving into Sunday and into the following week and the ECM is even more progressive than the 12Z!
http://www.wetterzen...cs/Recm1681.gif
Excellent consistency from the models of a Greenland HP. Obviously detail isn't worth discussing but the risk of snowfall looks like continuing into the following week.
I forgot to add that during tonight/tomorrow a risk of light snow in E areas as we pull in the colder E,ly.
I agree the latest models are showing a severe spell of cold weather for next week ,into the following week .Monday night is when it seems it really starts to bite.Whether it will bring much snow with it is still to early to say ,but it seems the whole country will be hit ,particularly the E and SE,as the snow depth data models on this site seem to indicate.
-
Scientists have uncovered more evidence of a dramatic weakening in the vast ocean current that gives Western Europe its relatively balmy climate by dragging warm water northwards from the tropics.
The slowdown of the North Atlantic Drift, which climate modellers have predicted will follow global warming, has been confirmed by the most detailed study yet of ocean flow in the Atlantic.
Most alarmingly, the data reveals part of the current, usually 60 times more powerful than the Amazon River, came to a temporary halt during November 2004.
The nightmare scenario of a shutdown in the meridional ocean current that drives the Gulf Stream was dramatically portrayed in disaster film The Day After Tomorrow.
That scenario had Europe and North America plunged into a new ice age virtually overnight. Although no scientist thinks the switch-off could happen that fast, they do agree that even a weakening over a few decades would have profound consequences.
The Gulf Stream originates in the Gulf of Mexico, flows up the US east coast, then crosses the Atlantic, where it splits in two, with one branch crossing to West Africa. The other branch, the North Atlantic Drift, extends towards Europe. The warm water it brings to Western Europe's shores raises the temperature by as much as 10 degrees in some places and without it the continent would be much colder and drier.
Researchers are unsure what to make of the 10-day hiatus in the current in 2004.
"We'd never seen anything like that before and we don't understand it. We didn't know it could happen," said Harry Bryden, of Britain's National Oceanography Centre, who presented the findings to a conference in Birmingham on rapid climate change.
Is it the first sign that the current is stuttering to a halt?
"I want to know more before I say that," Professor Bryden said.
Lloyd Keigwin, of the Woods Hole Oceanographic Institution in the US, said the 2004 shutdown was "the most abrupt change in the whole [climate] record". "Suppose it lasted 30 or 60 days, when do you ring up the prime minister and say let's start stockpiling fuel? … How can we rule out a longer one next year?" he said.
Professor Bryden's group stunned climate researchers last year with data suggesting that the flow rate of the Atlantic circulation had dropped by about 6 million tonnes of water a second from 1957 to 1998.
If the current remained that weak, he predicted, it would lead to a one-degree drop in temperature in Britain in the next decade. A complete shutdown would lead to a four- to six-degree cooling over 20 years.
-
Up to about Tuesday/Wednesday the model are fairly consistent with each other,and its pretty much a cert that the UK is in for a cold blast that could turn out to be a prolonged cold spell with much snow.Seems the SE is going to cop it most,what do you think?
-
North Atlantic Drift (Gulf Stream)
The Gulf Stream is the most important ocean-current system in the northern hemisphere, which stretches from Florida to north-western Europe. It incorporates several currents: the Florida current, the Gulf Stream itself, and an eastern extension, the North Atlantic Drift. The Florida Current is fast, deep, and narrow, but after passing Cape Hatteras the Gulf Stream becomes less effective at depth and develops a series of large meanders which form, detach, and re-form in a complicated manner. After passing the Grand Banks (off Newfoundland), the flow forms the diffuse, shallow, broad slow-moving North Atlantic Drift. The relatively warm waters of the North Atlantic Drift are responsible for moderating the climate of western Europe, so that winters are less cold than would otherwise be expected at its latitude. Without the warm North Atlantic Drift, the UK and other places in Europe would be as cold as Canada, at the same latitude. For example, without this steady stream of warmth the British Isles winters are estimated to be more than 5 °C cooler, bringing the average December temperature in London to about 2°C.
Within the Gulf of Mexico, the Gulf Stream is very narrow, only 50 miles wide, and travels very fast at 3 mph, carrying water at about 25°C. The North Atlantic Drift widens considerably to several hundred miles, slows to less than 1 mph and splits into several sub-currents. Off the British Isles it splits into two branches, one going south (the Canary Current) and the other going north along the coast of W and N Europe, where it exerts considerable influence upon the climate as far as northwestern Europe. For example, the Drift is particularly important because it keeps many Norwegian ports free of ice throughout the year.
The two main driving forces behind it are the prevailing southwesterly trade winds and the circulation of the water far below the oceans surface, the North Atlantic Deep Water (NADW) circulation. Water in the north Atlantic sinks because it is dense. Density of water is increased by both salinity and temperature - the colder and saltier the water is the denser it is. This deep water flows to the Gulf of Mexico until it warms enough to resurface and flow back north as the Gulf Stream.
Some 11,000 years ago the NADW shut down in response to subtle shifts in global climate. This slowed and diverted the course of the Gulf Stream to such an extent that the regional climate of the Northeast Atlantic became considerably cooler. As a result Northwestern Europe dropped back to ice age conditions within tens of years. It is now suspected that global warming may trigger a shutdown in the NADW, and a slowing or diversion of the Gulf Stream, which would ironically lead to colder climates throughout the UK and Northwest Europe.
The film "The Day After Tomorrow" is based on this weather dynamic,and the drastic consequences that could result if the NAD did stop
-
So much variability still in the weather systems,its pointless looking beyond Sunday night ,75hrs,for any degree of accuracy.That huge block of cold air out to the NE still looks very menacing and I wouldn't rule it out that come next week it will be over us.
-
Serious snowfall in the winter of 1947
Thousands of people were cut off for days by snowdrifts up to seven metres deep during the winter of 1947, which saw exceptional snowfall. Supplies had to be flown in by helicopter to many villages, and the armed forces were called in to help clear roads and railways.
Between January and March that year, snow fell every day somewhere in the country for 55 days straight. Much of this settled because temperatures stayed very low, just above freezing most days.
No-one expected this winter to be severe, as January started with very mild temperatures at up to 14 °C recorded. This was soon to change, however. An area of high pressure moved over southern Scandinavia, setting up a weather pattern which dominated the UK for the rest of the month. The first snow came on 23 January, falling heavily over southern England. Blizzard conditions occurred across the south-west of England, leaving many villages in Devon isolated.
The cold, snowy weather continued through February and into March. Any breaks in the cold weather were short-lived.
- In February, the temperature at Kew Observatory did not go over 4.4 °C and the night minimum temperature only went above 0 °C twice.
- The mean maximum temperature for the month was 0.5 °C (6.9 °C below average) and the mean minimum was -2.7 °C (4.6 °C below average).
- Mean minimum temperatures were more than 4 °C below average everywhere in southern England, and almost 6 °C below average in some places.
Another unusual feature of February 1947 was the lack of sunshine in the Midlands and south of England — a complete contrast to the north-west of Scotland, where the weather was unusually sunny.- At Kew, Nottingham and Edgbaston, there was no sun on 22 of the month's 28 days.
- Most of the Midlands and southern England had sunshine totals about 40% of the average.
When skies did clear, night-time temperatures plunged. Woburn in Bedfordshire registered a low of of -21 °C early on 25 February.
If February hadn't been bad enough, March was even worse. In the first half of the month, there were strong gales and heavy snowstorms, making for blizzard conditions. On 4 and 5 March, heavy snow fell over most of England and Wales, with severe snow drifts forming. On 6 March, drifts were five metres deep in the Pennines and three metres deep in the Chilterns.
On 10 and 11 March Scotland had its heaviest snowfall of the winter, with snow drifts up to seven metres deep reported by 12 March. The snowstorm heading over Scotland was to be the last over the UK for this cold spell, however. As it moved away, temperatures were already rising in the very south west of the UK. Temperatures rapidly got up to about 10 °C, and the leftover snow began to thaw rapidly. This created a serious problem. The ground was still frozen solid due to the weeks of cold weather, leaving the melting snow with nowhere to go.
As the warmer weather moved across the UK, the melt-water poured into rivers and caused many to burst their banks. Flooding problems began to spread across England from the south west, as a new depression came in from the Atlantic, bringing rain and severe gales. During the afternoon of 16 March, winds over southern England averaged about 50 knots, with gusts of 80–90 knots. This caused damage to buildings and caused even more problems as the strong winds created waves which pounded and even broke some flood defences.
River levels continued to rise. The banks of the Trent burst at Nottingham on 18 March and hundreds of homes were flooded, many to first floor level. While floods in the south-west England began to subside, other rivers continued to rise in eastern England. The Wharfe, Derwent, Aire and Ouse all burst their banks and flooded a huge area of southern Yorkshire. The town of Selby was almost completely under water. Only the ancient abbey and a few streets around the market place escaped inundation. Seventy per cent of all houses in the town were flooded. The flooding issues continued into the spring, bringing a nasty end to the cold and snowy winter..
And we thought we had it bad recently!
The winter of 1963 — the coldest for more than 200 years
With temperatures so cold the sea froze in places, 1963 is one of the coldest winters on record. Bringing blizzards, snow drifts, blocks of ice, and temperatures lower than -20 °C, it was colder than the winter of 1947, and the coldest since 1740.
It began abruptly just before Christmas in 1962. The weeks before had been changeable and stormy, but then on 22 December a high pressure system moved to the north-east of the British Isles, dragging bitterly cold winds across the country. This situation was to last much of the winter.
A belt of rain over northern Scotland on 24 December turned to snow as it moved south, giving Glasgow its first white Christmas since 1938. The snow-belt reached southern England on Boxing Day and parked over the country, bringing a snowfall of up to 30 cm.
A blizzard followed on 29 and 30 December across Wales and south-west England, causing snowdrifts up to 6 m deep. Roads and railways were blocked, telephone lines brought down, and some villages were left cut off for several days. The snow was so deep farmers couldn't get to their livestock, and many animals starved to death.
This snow set the scene for the next two months, as much of England remained covered every day until early March 1963. While snow fell, and settled there was still plenty of sunshine. The weak winter sun did not warm things up, however, as the lack of cloud cover allowed temperatures to plunge. In Braemar in Scotland, the temperature got down to -22.2 °C on 18 January. Mean maximum temperatures in January were below 0 °C in several places in southern England and Wales, more than 5 °C below average. Mean minimum temperatures were well below freezing. Temperatures weren't much higher for most of February.
The long bitterly cold spell caused lakes and rivers to freeze, even sea water in some of England's harbours turned to ice. Ice patches formed at sea and on beaches. Winter didn't fully relax its grip until 4 March, when a mild south-westerly flow of air reached the British Isles. By 6 March, there was no frost anywhere in the British Isles and the temperature in London reached 17 °C — the highest since October 1962.
Finally, the coldest winter for more than 200 years in England and Wales had ended. With the thaw came flooding, but nothing like the scale of the 1947 floods. Soon after the winter had ended, life returned to normal.
Kind of puts it into perspective doesn't it when we moan about how cold it has been these last few weeks.!
-
Actually it wasn't just UKMO - I distinctly remember commenting 2 days ago on the ECM blasting away embedded cold from Scandi (which has been there for 2 months at least now) in just 24 hours and saying it was ridiculous run that had no chance of happening.
I think there's a lot of room for improvement in the weather models in respect to their progressive nature in regards to long standing surface cold; it's also fairly obvious that they're struggling with both the stratospheric warming and MJO wave in the tropics too. To be fair they are up against a combination of circumstances that possibly hasn't happened for 20 years or so, but it does rather indicate that they still fall short when it comes to handling old school weather patterns.
I agree,regarding the weather models being so uncertain.Basically there are so many variables to consider, the accuracy just goes out the window .No amount of sophisticated weather software ,no matter how advanced it is, can make an accurate assessment of weather patterns beyond a week,and that is being generous.High energy pressure systems that we have seen develop can change the whole nature of forecasting.Just consider how much the models have changed in the last few hours let alone the last few days.I think to look beyond 2 or 3 days models with any confidence is very questionable.


 ) have any effect whatsoever on the Gulf Stream, or is it just a drop in the ocean? (pun not really intended!)
 ) and melted even more ice....would that have any effect?


 Serious snowfall in the winter of 1947
Worst Hay fever season in decades feared
in Spring Weather Discussion
Posted
The high temperatures are really elevating those pollen levels ,hayfever has never been so bad.Nothing works to to any great extent to relieve my symptoms..tried the lot ,over the counter and perscription.,Any suggestions?