


WYorksWeather
-
Posts
1,548 -
Joined
-
Last visited
-
Days Won
4
Content Type
Forums
Blogs
Gallery
Events
Learn About Weather and Meteorology
Community guides
Posts posted by WYorksWeather
-
-
Slightly lower than I expected today - minima did fall a bit lower last night than I thought. But 14.0C is still a fairly high mark. Today also looks lower than Derecho's figures.
In terms of targeting the record - by my maths we'd need an average in the high 15s to match 1833 and an average in the low 16s to beat it from here. Probably pretty unlikely, especially if we see a hold or a small drop for the rest of this week, as that would then push the target up to nearer 17C.
I do note tonight that there are one or two ensembles that might get the job done - the GFS P23, possibly the GEM P10, and I wouldn't be surprised if there are one or two ECM ensembles later that might get close. But it is a pretty tall order.
Overall I'm feeling pretty good about my 14.3C guess. I feel like I'm in with a good shout at being within half a degree. I'd probably put 14s as the most likely finish since there is a slight warming trend in most of the ensembles tonight towards the end, with a moderate chance of a 13s finish and a low but still plausible chance of a 15s finish.
For the 15s finish to happen we need to see some of the more extreme warm ensembles start to gather strength, or for temperatures this week to hold up enough to allow the CET to rise slightly by the weekend, which would then allow a more ordinary warm spell to finish the job.
-
 2
2
-
-
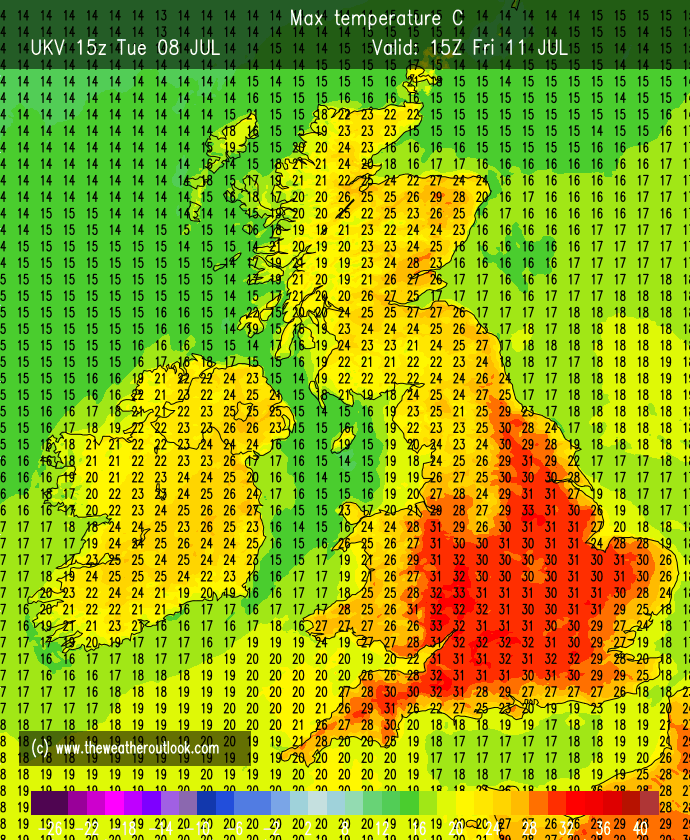
Addicks Fan 1981 I posted a comment on the GFS output for the rest of the month - still awaiting ECM, which I might not get around to posting as I'm back at work this week and up fairly early tomorrow. Depends what time it rolls out fully.
On UKV, tomorrow looks like the 'worst' day with many areas stuck around mid-teens and plenty of rain around, but its hard to call it atrocious as some areas that have brighter spells will still see 20C in between showers.

Wednesday is a better day overall but still poor in some parts of central and eastern England for temperatures. Elsewhere warm and mostly dry, albeit generally cloudy. Max of 24C for Scotland, 21C for England.
Thursday is fairly similar to Wednesday.
Friday looks to hold temperatures down a bit more - showers and cloud seem more widespread. Some of them look thundery.
Now probably getting a bit beyond the reliable for this sort of detail but just for fun Saturday looks a bit worse than Friday if you're further north or east but still decent in the south and west.
Summary
In short - is it the best weather you could possibly hope for in May? Probably not. Is it terrible? Also no. It looks like a fairly standard mid-May period - a mixture of sunny spells and showers, cloud, and slightly milder than average by day and well above average by night. Again, depending on location your mileage may vary from day to day but I think across the week as a whole most areas will get a reasonable range of conditions.
Today in my area for example has been sunny through most of the early to mid-afternoon and warm with temperatures over 20C, whereas elsewhere it has been a fairly poor day. That sort of regional variation is probably going to be the story of the next few days. The exact pattern probably won't be as shown here - especially beyond day 3 or so as it becomes harder to nail that sort of detail even with a high-res model like UKV.
Beyond that, as my previous post with the GFS showed, models are hinting at higher pressure into the middle to end of next week, but it's too early to be absolutely sure of the strength of that signal.
-
9
-
-
Alderc 2.0 Don't want to derail the thread with this so will be my last reply on this point (happy to discuss elsewhere though).
I think you might have misunderstood my comment - the point I was making was that a significant number of pro forecasters stated in debates at the time that those temperatures were fundamentally impossible because of a flaw in the GFS. I wasn't suggesting that the GFS didn't show those temperatures, but that they couldn't quite have corresponded to reality. 41-42C might have been possible for the UK, but not 44C.
I don't want to get hit with a moderation stick - this is potentially moving off direct model discussion around UKV vs. GFS and more of a retrospective of July 2022. Happy to carry on this conversation but not in this thread
 .
.
-
1
-
-
Rather than looking so much at individual runs, I think the overall pattern from the GFS ensemble tonight is pretty instructive. Picking Leeds as an example, but the general trend is the same in a lot of places:
Above average 850hPa temperatures likely for the next 10 days (too much scatter beyond that, but if anything warm outliers increase towards the end). Above average temperatures by day (when adding usual 1-2C for GFS under-reading) and significantly above average by night. Pressure recovering to average or above average after a dip early this week.
Overall based on these charts I'd be favouring a warm end to May, and probably increasingly settled again. Difficult to call whether it will be changeable from day-to-day or whether we will see a more long-lasting area of high pressure before month's end. But nothing suggests to me that the medium term outlook is poor. And even the next few days will not be universally poor everywhere.
-
4
-
-
-
dryfie I use weatherobs as well, but it doesn't show up any inter-hourly readings I don't think, just on the hour, so there is still the possibility of fractionally higher readings coming in later on.
The other one we can never account for until the Met Office say so is if a manual report exceeds one of the automatic stations. I remember this happening late last week I think.
-
Don I don't think you're completely out of luck. Admittedly though we would need the CET to rise no further over the next week, and then probably a slow fall associated with cyclonic conditions.
Tonight's ensemble means are all near average. Probably increasing confidence in a 14s finish with that, but given the spread neither 13s nor 15s can be ruled out.
In a way a 14s finish feels right - it's a weird oddity that we've not had a May even approach the 1833 record since then. It would be completely bizarre if we skipped the 14s entirely and recorded a second May in the 15s before a single 14.
-
 1
1
-
-
- Popular Post
- Popular Post
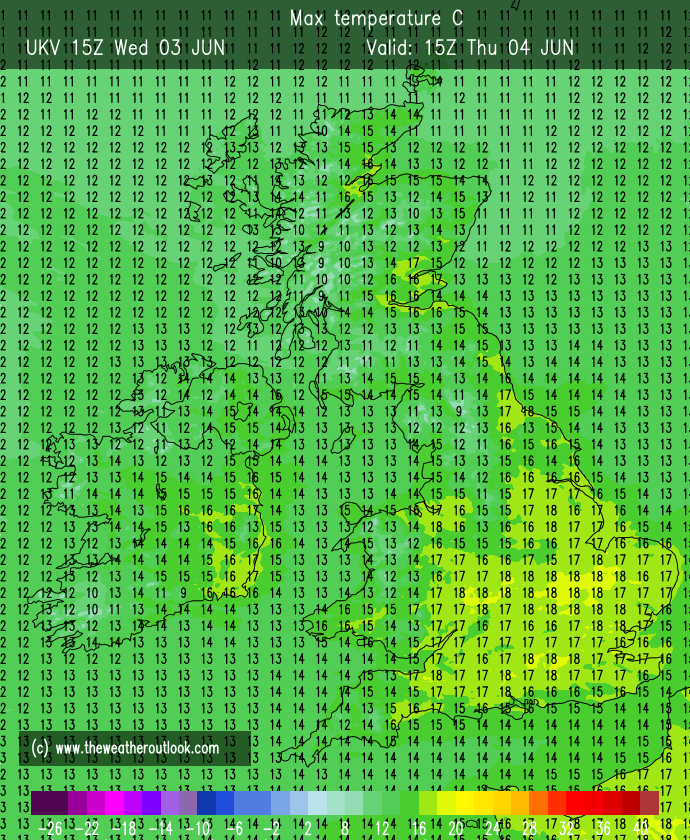
Right, latest UKV update. I'm back at work tomorrow (I picked a good week to be off!) so won't be around for too many of the evening model runs, but have time to do tonight's UKV.
Starting with tomorrow, we have a warm day to come for eastern areas but much cooler further west due to a band of rain.
Much cooler on Tuesday overall, though some western and south-western areas will have a warmer day than Monday. Absolute maximum is 21C in northern Scotland but very localised. Most places will see mid-teens.
Wednesday looks better away from central and eastern areas, with temperatures quite widely into the high teens or low 20s. Again Scotland the warmest spot with a localised 24C.
Thursday is showing widespread high teens or low 20s, with an absolute max of 22C.
Friday is similar with fairly widespread high teens and low 20s, and an absolute max of 23C.
Summary
Overall, tomorrow looks like the worst day for southern and western areas. Tuesday the worst overall day for most areas. Tuesday and Wednesday worst for many central, eastern and northern areas (away from Scotland).
Overall though - it's not looking like a horrendous working week, more of a mixed one. A fair bit of rain around, but it doesn't look anywhere near as bad as it looked a few days ago.
-
12
-
Roger J Smith Likely 14.1C or 14.2C after tomorrow I think.
Key will be the next few days whether the surface conditions and timing of any rain/cloud are conducive to rises or falls. If we get cloudy days and clear nights CET will head down, vice versa it will head up.
In order for a record-challenging month to happen we probably need CET to be at minimum mid-14s by this time next week, and then we would need a very warm or hot final ten days to seal it. More likely though I think is a finish in the 14s which would be of course the second warmest May ever recorded.
-
4
-
-
Mark Walker Yeah you're right from the looks of the radar, maybe more straight N which would put it more Tadcaster / Wetherby area.
-
1
-
-
Mark Walker If that one heads N or NNE and keeps going you'd think maybe York in its sights perhaps?
-
summer blizzard Yep, bit of a waiting game I think. Lots of storms around just whether any make it over this way.
-
1
-
-
In any case it is irrelevant - Iver has topped that with 27.0C (rounded to 1dp, actually 26.98C technically!). Not sure if anywhere else has topped that - am sure that Met Office will report later on with the highest.
markyo Yeah it will still be cooler next week - but not as cool as had been forecasted. Previously it was thought the wind direction might be more westerly but it now looks like predominantly southerly to south-easterly through the early part of next week at least.
-
1
-
-
LetItSnow! I think it's more complicated than that. From my understanding of discussions online a couple of years ago, it is a case of how the models deal with soil moisture content. In generally wet areas like the UK, the bias is towards underprediction. But in much drier regions, and on rare occasions you'll see this in the UK after exceptionally dry spells like July 2022, particularly in the case of the GFS, you can start to see overprediction. E.g. some rogue GFS runs predicted 48C for NW France and 43-44C for the UK if I remember rightly, which was never really feasible.
In contrast, the UKV, being a Met Office model and at a more local scale for the UK and its immediate surroundings, is tuned to conditions in the UK, and of course is run at a much higher resolution feeding in from the UKMO. It therefore has a much better ability to predict temperatures, but of course has the disadvantage that it is limited to the UK only.
Very happy to be corrected on this by the pro forecasters on here if I've missed something important or got something wrong - this is solely based on my memory of the comments of a number of forecasters on Twitter in the run up to the July 2022 heatwave.
-
6
-
1
-
-
Is it just me or from the looks of things does it seem like the earlier forecasts were better? It seems like the forecast was more western parts only up until yesterday, then some chatter about possibly further east, and verification looks closer to the more westerly solution? Seems unlikely looking at the radar that any storms will make it here unless I'm missing something?
-
Addicks Fan 1981 You are right in fact though as it seems that Iver has reached 27.0C (rounded to 1 dp). In any case probably splitting hairs a bit at this point - overall not a bad performance from UKV hovering between 26C and 27C. I'd only really call it a miss if we'd seen 28C or 29C, or vice versa if we'd seen 24C or lower.
-
4
-
-
Derecho Thanks - I've tried using Meteociel for the temperature tables and they're not as good - will have a go with Wetterzentrale later.
I'll probably pick something eye-catching off the 12z runs and see what I can come up with.
-
TwisterGirl81 Yeah it's not surprising it's wrong in a few areas - it tends to be to be honest even at very short notice. But overall I do think UKV is much better for on the day temperatures than most of the other models. GFS and ECM are absolutely chronic for under-reading.
-
5
-
-
Derecho Was going to ask actually - what's your methodology for compiling these (i.e. which site do you use for the raw data and to obtain values for the CET stations - the maths isn't an issue)?
Just asking because I'd be interested in trying to do something similar for some of the more extreme ensembles that are popping up - in other words to try and see if some of the hotter ensemble outliers would be enough at this stage.
At the moment my feeling is that only the very hottest ensemble members are likely to do it, but it would be good to check my working.
-
1
-
-
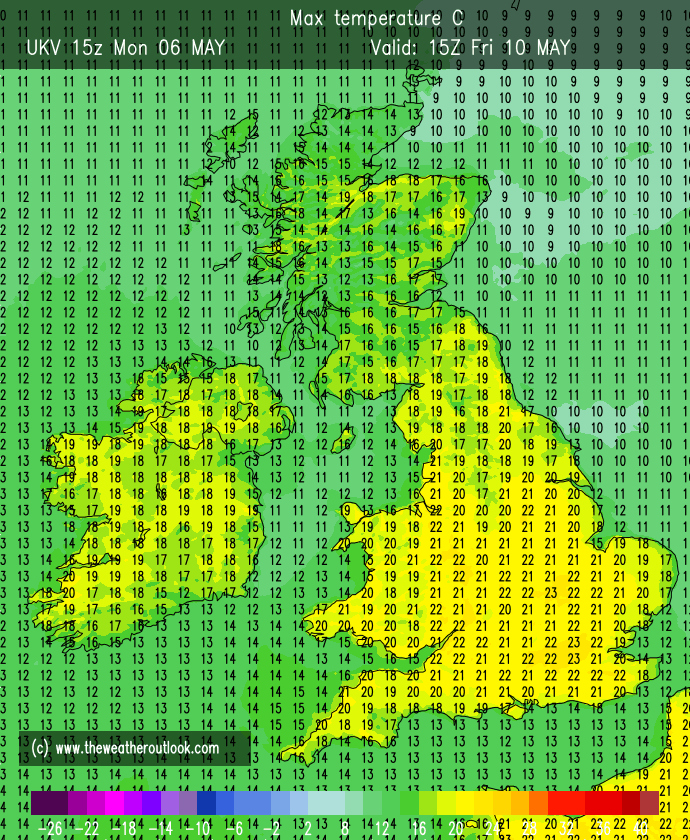
Earthshine And your location has close to the worst of it. Even with a slight overnight downgrade the UKV this morning shows absolute UK maxes of 23C tomorrow, 20C Tuesday, 22C Wednesday and 21C Thursday.
All in all as you say not a horrendous first few days to come, just less good than this week.
-
3
-
-
Just comparing Meteociel's temperatures from today to yesterday at the same time:
Most areas further north and west are cooler, but in terms of absolute maximum the south is getting a good start on heating up today.
The key is whether thunderstorm development scuppers the last degree or two of heating in the afternoon. Theoretically there's no reason we can't reach 27-28C, but we'd need no sea breezes and no significant cloud development in the hottest areas before 2pm or 3pm.
-
2
-
-
UKV has backed off again at the last go - 26C the max on this morning's chart for this afternoon. Probably a nowcast at this stage.
-
2
-
-
-
3
-
-
Don I think we still don't have enough of a sample size yet to know how rare below average 1961-1990 months are now. Up until recently I was thinking 10%, about one per year. If we don't get one by the end of this year though, I might have to reassess. Possibly you'd have to start saying 5%.
It's definitely going to happen at some point - the middle of January and second half of April this year prove we can still get significantly below average spells of weather - we just need one to be sufficiently prolonged to enable a below average month and to not be counteracted by a strongly above average spell at another point in the month. Very difficult to predict when it might happen, though.
It's just that the odds indicate that it pretty much must happen at some stage, since I can't really believe that we've moved so far in the last two years that e.g. a December 2022 repeat will never happen again. Even if you added a bit on to the anomaly it'd still be below average if the same synoptic had repeated last winter.
As always, more data needed. If we go another full year or two with no below average months on 1961-1990 I'll have to revisit this question.
-
3
-


.png.12db9d2c49779dbb51ad1166f62c98fa.png)
.png.9998ae2b3361848b2532a7a20c3f19e9.png)
.png.ee8ceaeaed7af8b88c66df2ca73a3ac1.png)


Model Output Discussion - Spring Has Sprung
in Forecast Model Discussion
Posted
damianslaw I didn't comment on the ECM 12z yet because the ensemble hasn't finished rolling out yet. Not much point commenting on it if it's amongst the worst/best in the suite for settled weather.
We do have the clusters though.
All 3 look reasonably settled at days 5-7, especially further north.
At days 8-10, cluster 1 looks mixed, 2 is generally settled, 3 is generally unsettled.
In short we have a settled interlude looking fairly likely at day 5-7 especially further north, and 8-10 just a lot of uncertainty.