


Mr Sleet
-
Posts
380 -
Joined
-
Last visited
Content Type
Forums
Blogs
Gallery
Events
Learn About Weather and Meteorology
Community guides
Posts posted by Mr Sleet
-
-
A truly outrageous piece of alarmist "journalism" in the Independent (yeah, if only) today:
http://www.independent.co.uk/environment/c...ole-855406.html
The journo has been truly flamed in their have your say section - the best comment I saw is quoted below. Sometimes it's so hard to counter things like "North Pole never known to be clear of ice in human history", and "northwest passage opens for first time in recorded history". Both statements, apparently, are untrue.... (I love the way the posting changed my original "bllx" to "dog biscuits" - a replacement profanity checker, what a brilliant idea :o )
I read the article. Some of the comments by so called "scientists" are what makes me distrustful of them, and I have been a scientist in R&D for 21 years !
-
You know as well as I do that 1850 was at approximately the coldest point in the last 1000 years or so and even the IPCC has admitted that the warming before 1980 was simply natural variation.
come on Andy if you are going to make a point please do it accurately, see the chart below from many thousands of years ago up to the present time, which, unless I am completely losing my marbles, (always a distinct possibility at my age), then it shows that it is indeed a cold part but only for 200-300 years not 1,000?
1=min and my version of the mean for 1601 and the same labelled 2 for 1851

Thanks John. That graph makes me wonder what all the fuss is about re: global warming. :o
-
So, from that dismissive comment, I assume you do not agree that there is any form of anti-AGW lobbying on the part of the oil companies?
Would it help if I posted some less socialist ( :o ) newspaper articles on the subject?
http://business.timesonline.co.uk/tol/busi...icle3868988.ece
http://www.telegraph.co.uk/news/uknews/147...te-charity.html
I'm sorry, but I couldn't find anything in the Mail or the Express........ :o
Well if you could find something in the Sun you would have a convert :lol:
-
Spring 2008 was still between 0.5 and 1.0C above the 1971-2000 average, thanks to the warm May.
I don't think the 71-2000 average is relevant to Bluecons question, probably better to use a rolling 30 year average, ie 77-2007, which would put MarchApril May just a bit cooler than normal. :lol:
Probably we should now wait to see if Bluecons feels his question has been answered :o
-
This has been alluded to in other threads, but I thought it might deserve a thread of it's own.
There is mounting evidence that global policy is being influenced, but not necessarily by those who have been so far accused on these boards...
http://www.spinwatch.org/content/view/4104/8/
http://www.ucsusa.org/global_warming/scien...anizations.html
http://www.greenpeace.org/usa/campaigns/gl...y/exxon-secrets
http://www.corporatewatch.org/?lid=289
http://www.guardian.co.uk/environment/2006...petrol.business
http://www.independent.co.uk/news/world/eu...ing-427404.html
Having had so much discussion of the bias of IPCC scientists, the MetO, etc, etc, I thought it was about time we levelled the playing field a little.
With hugely wealthy trans-national oil companies, etc having a vested interest in disproving AGW, is it not possible that the most influential bias/propaganda/lobbying being done benefits the skeptics, rather than the proponents, of AGW?
And, if so much money has been poured into this, how come they still can't find any solid evidence to disprove the findings of the IPCC?
Blogs, anti-capitalist environmental pressure group and Socialist newspapers. To me, hardly surprising or convincing.
-
You are kidding me/us aren't you. Spencer, Wattsupwidat, a US political website....
This whole thread is a giant wind up.
Fact is, in recent years we have cooled, as John's chart shows. The question is, will the cooling continue ? Nobody knows.
-
I have to say there are one or two posts on here that are quite frankly pretty ridiculous in terms of scientific content.
Can we please have some genuine input with a bit more rigorous proof being shown or linked?
John if I wanted that an internet messageboard wouldn't be my first port of call
I think this debate is entertaining amateur stuff, end of. And I think the Met Office scientists are probably very good, it is the spin that comes out of the climate centre that is dubious, it's hardly balanced IMO. -
The fact is, it's still been coming out above the 1971-2000 average for the first half of 2008, and the period 1971-2000 was warmer than any previous 30-year period.
January, February and May all well above the average, March, April and June close to the average. Departure currently running at around 1C over the 1971-2000 mean, and nearer 1.3 above the 1961-90 mean.
Globally it's been cooler than many recent years so far, hovering around the back end of the top 10 of warmest years, but we have had a significant La Nina episode which contributed to this.
All true I'm sure, but Bluecon asked about Spring and Summer 2008 , March/April/May/June which were average apart from May , which was well above average.He didn't ask about winter, global temps or the 61-91 mean. Just answering his specific question.
-
dont want 2 rain on your parade but the date you have picked is the 6th sept 1995..not 9th june 1995...americans rite months\and days other way round..lol
You are not raining on my parade, I picked the 6th September 1995 because that was around the date of the ice area minimum
Mr S.Please read my post. Last year , once mobile ,a large mass of perennial ice choked a small section of the Eastern passage making it impassible. This year that 'log jam' will melt and the passage will open again. And yes, over the past 15 years (since the rapid melt of that side of the arctic) a clear Eastern passage has been a regular visitor in mid Aug on. The 'hot weather' to the lands north of the Baltic over winter resulting in the lowest winter ice levels ever measured there will, in all probability, mean the passage is open at the same time as the NW passage.
If comp.s are planning to send large ships over the top then the soot they will pump out may well help condemn the ice in the high arctic too as the lowered albedo allows perennial ablation rates to jump up.
Nah, the ice you refer to wasn't a floating bit that choked the channel in 2007, it never actually melted from the winter and remained anchored to the main arctic basin ice. I was following that with interest. A quick look back will confirm that.
Also open in Sept 1984, 24years ago. Doesn't look like the ice is all that perennial to me
But I do agree with you about the soot, that is not good.
-
I have another question not really related to fruit and veg though. We planted some little hedging plants round our compost in the hope they would grow big quick and cover up the compost heap. We planted them 6 weeks ago and they don't seem to have done anything! Any advice? I have them some liquid feeder over 2 week periods and yesterday I also put round them some of those slow release balls of food. They are dug in with new compost. I've ran out of idea's!
Not sure about which hedging you are using but they are normally quite slow growing and take a while to establish before they start to gain height, maybe 3 or 4 years is more realistic. You say they are around your compost- is it rotting compost if so, not good as that takes nitrogen out of the soil.
Is it a sunny site ?
My advice is give it more time.
PS See my tip above regarding garlic to stop slug attack.
-
Snow in Sydney?
When?
Also please explain the current run of top ten months we are having for warming lately. March was the warmest land temp on record. If this is cool pass me my hat.
It's true, Bondi beach is under that lot somewhere !!
-
As it was last year with the Eastern passage blocked by drifted multiyear ice . This year the Eastern passage is also forecast to be open by August so we'll just have to sit back and watch. If it is then that's another batch of perennial turned back into water .
Oh dear, yet more spin GW you naughty boy !
The eastern passage opens up fairly often as far as I can see, I have picked one year at random (1995 ) although I haven't done a thorough analysis. see below :
So it's not as though it's always been perennial ice.
-
The spring here has been very cold and the summer continues the pattern. Is it above average temps in England?
The CET ( Central england Temperature) has been about average apart from May, which was well above. We are looking at our coolest June since 2002.
-
Solar cycle 23 is going to be about 13 years long. The longest since 1790. it’s been known by solar scientist that the longer the solar cycle the weaker in amplitude of the next 2 solar cycles. Solar cycle 24 is going to be very weak. Solar Cycle 24 and 25 should take us up to 2030. The weak amplitude of solar cycles 24 and 25 will likely cool the globe for 30 years. The earth as already cooled over the past 2 years and is likely to accelerate over the coming years. China as already seen their coldest winter for 100 years. Sydney has seen their first snowfall for decades.
As when the earth cools the temperature gradient increases between the poles and the equator. This will make the jet stream increase its speed from west to east. Britain’s autumn and winters will become milder, maritime in the short term. When the temperature gradient continue to increase between the poles and the equator the jet-stream becomes unstable and more likely to break up in to anticyclone blocking and cyclones. The anticyclone blocking will develop from Siberia to Iceland bringing in months of polar continental air to the UK in winter
The CO2 is to weak of a greenhouse gas to stop natural cooling. As when the oceans cools it will absorb all of the manmade CO2 and a large amount of natural CO2
Ice cores show temperature go up first then CO2 follows
The evidence supporting the manmade global warming hypothesis is getting less and less. There is a large amount of jobs and government tax dependent on the manmade global warming hypothesis so there will be allot of political spin in the data.
Great post SPM , lets hope for many more from you !
-
Me too !! Already chopping, sawing & stacking like a good 'un,
I can just see all the birds watching you chopping all that wood and saying (chirping ) to each other " beter eat plenty of berries boys, it's going to be a tough winter"; so a vicious circle is started...
-
Oh, I will have to try that one Mr Sleet
We seem to have tons of Slugs but I guess all the rain we get in Devon helps that
The cabbages just took forever and didn't really grow. The Brocolli got filled with little catterpillars and made me too squimish to eat it
Caterpillars ?Well, with the price of meat as it is, why complain ? You have a ready meal
Liming the soil in late autumn should promote growth in cabbages and broccoli. If you get strong growth the plants find it easier to shake off pest attack.
-
Hi All.
I had an allottment for about 7 years and grew all sorts of stuff, soft fruit , asparagus the lot. Just a tip for dealing with slugs - boil up garlic cloves in water.Dilute. Spray on crops to be protected. Solution should keep for a while if you keep it cool and dark.
You may need to experiment a bit with the strength and spray every few days or so. Don't worry, your veggies won't taste of garlic
Might also keep cats away.
Garlic Wash Recipe
Take 2 bulbs of garlic, crush them, and boil them rapidly in two pints of boiling water for approximately 4-5 minutes, or until there is a very strong garlic smell.
Let the liquid cool then strain it.
Top up to the two pints mark again and bottle the result.
To Use – Put one tablespoon of the Garlic Wash into one gallon of water and water over the plants with a fine rose making sure the whole plant is covered. This is a completely natural product and should do none of the other plants any harm.
You can add a bit of fairly liquid to the mix.
Sleet Out.
We were careful not to disturb the rootball but it could be early lack of nutrients. I have been giving them a nice little drinky of Miracle grow but the Main crop looks FUBRdTrial and error. It's our 2nd year in this garden and we are learning what does grow (courgettes and peas) and what doesn't (cabbages and broccolli)
Thanks for your tips though
Katie
If you wanted to grow cabbages and brocc but can't maybe you are a bit too acid ? Liming the soil in the cabbage patch should make it tickety-boo. ( there is a wrong and right time to lime though).
-
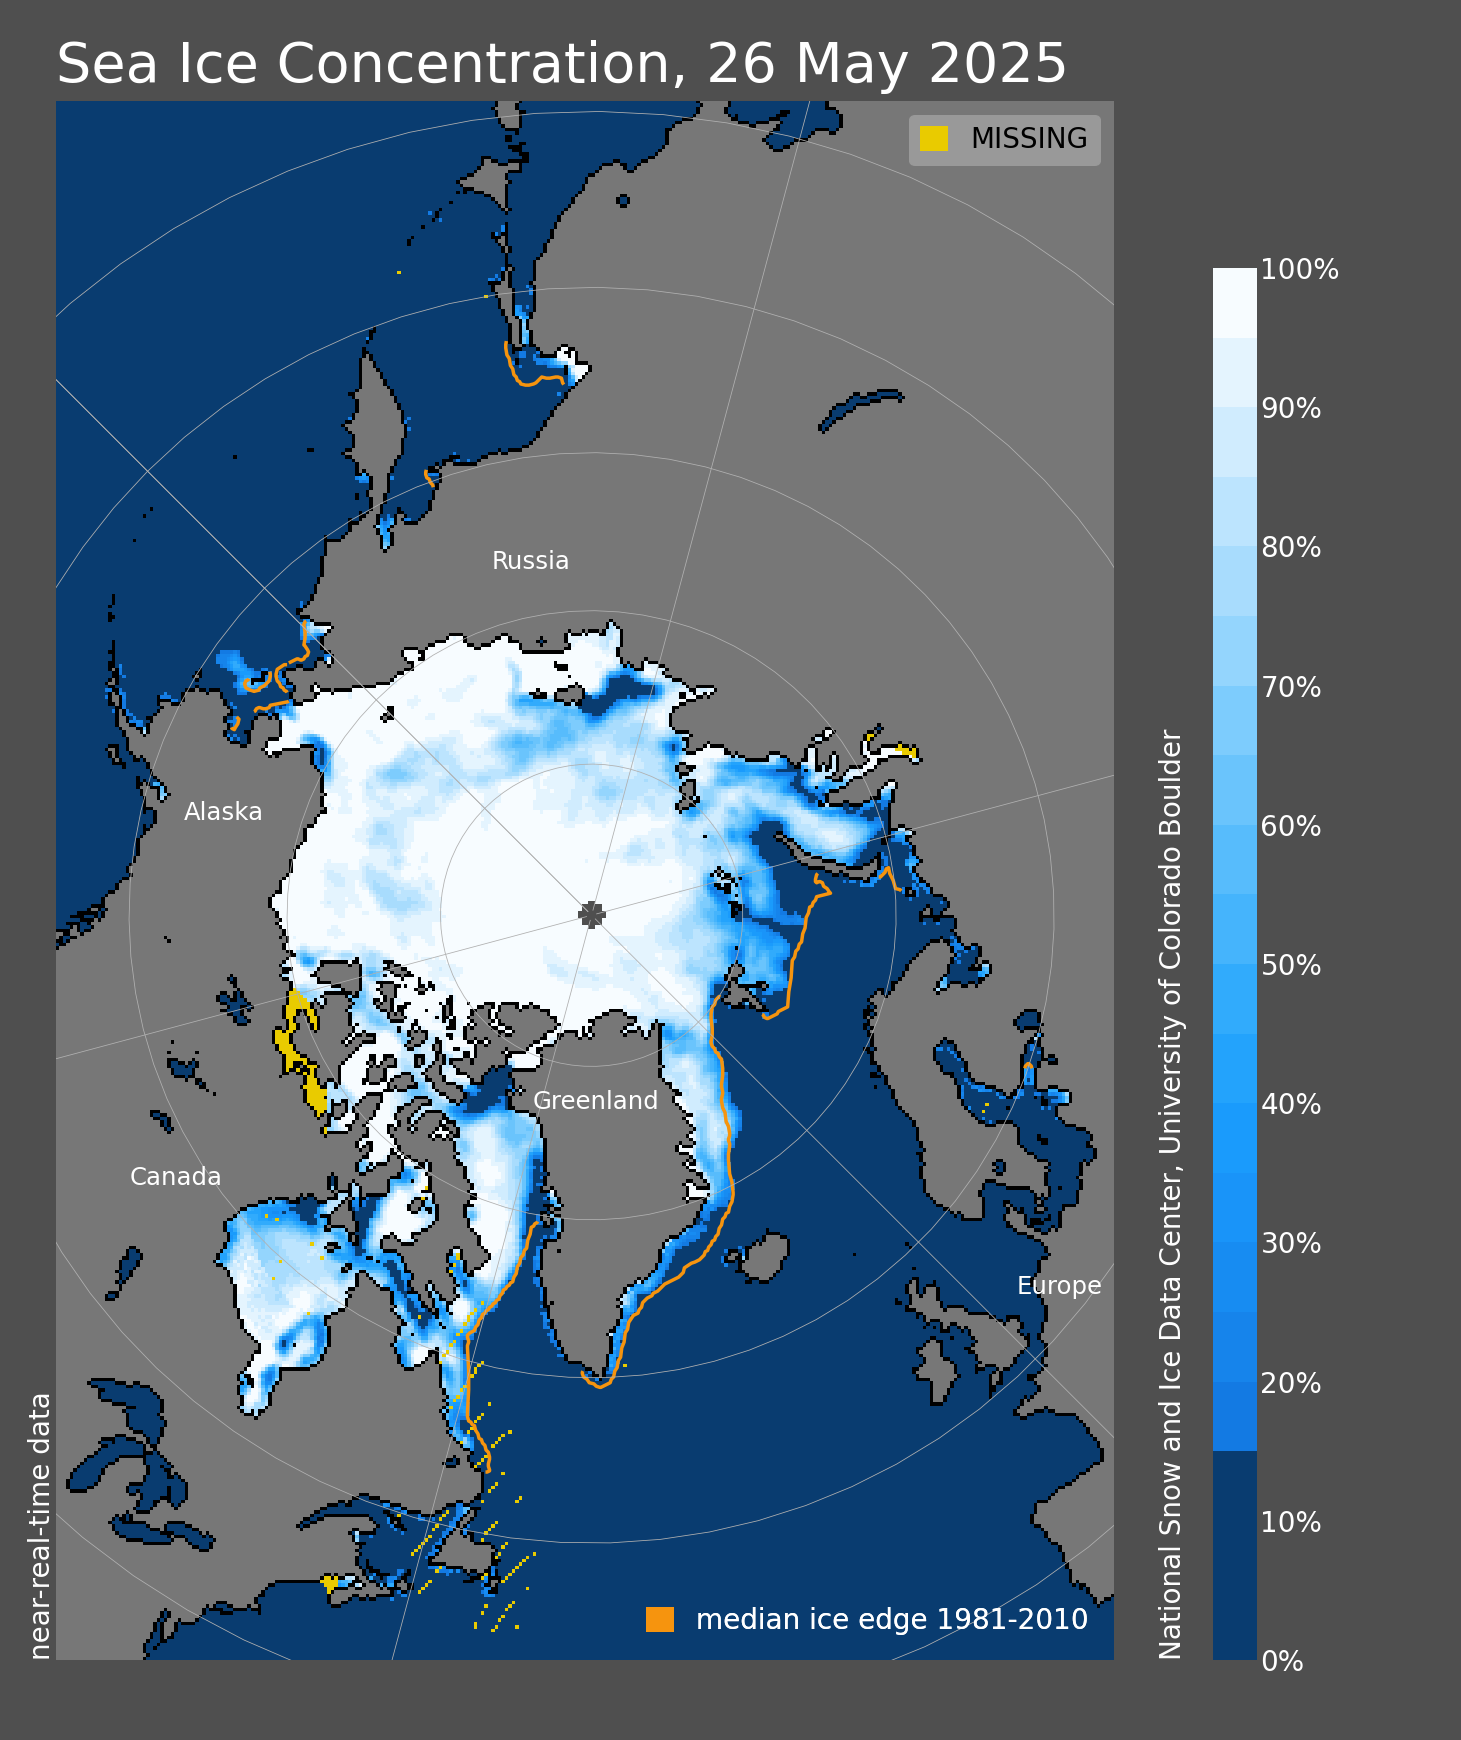
http://nsidc.org/data/seaice_index/images/...ation_hires.png
The link above takes you to the NSIDC image from June 21st. You'll readily see how poorly the ice in the Canadian Archipelago is faring and also , like last year, the ice facing Bering (north of Alaska and on to the Pole) is now starting to fail en-mass.
If ,like last year, we see a similar pattern of circulation once the ice is free moving we can discount the H.P. hypothesis from last year as being the primary driver for the melt and concentrate on influx of waters from the Pacific driving a new 'Polar Current' with waters entering through Bering and exiting via NW Greenland.
The opening of the 'Deep channel' NW Passage would also provide both a shortcut for such a flow but also give us a reason why the ice in those areas has failed so completely over the last few years leaving the weak single year ice as the only cover through winter.
One section of the 'passage' did have section of multiyear drift in before refreeze last year so it will be interesting to see how quickly these chunks fail (compared to the Canadian Coastguards predictions for their 'melt time') to also assess if warm water influx is starting to play a role in the final meltdown of sea ice (as BFTP notes there is still some cold still in the polar region).
Still above last year but probably not for long.
NH area loss speeded up a bit now. Got the humble pie from Waitrose yesterday but it is still firmly in the tin.
-
Hi
OK some straight talking.
If the mods were a bit tougher and kicked people off for provocative and downright insulting comments (it's only one or maybe two) then there wouldn't be a problem. I say shut it down. Some people seem to be on the site every waking hour, it may be kinder to close it and let them get a sense of perspective back. I say this with a compassionate tone as I worry for some contributors.
Mark ( Mr Sleet)
-
Melt rate slowing down :
-
Bluecon, the NSIDC have now updated the graph (see BBC News Online) and as at mid June it is clear that the amount of Arctic sea ice is at a similar level to mid June last year meaning that so far this year there has been an increased melt rate compared to last year. From the graph it is clear that last year the rate of melt increased significantly in the 6 weeks from mid June to late July. It will be interesting to see how things stand at the end of July this year.
So far the data appears to support those who have argued that the colder conditions in the Arctic last winter leading to an increase in both aggregate ice cover and the proportion of single year ice would not prevent a summer loss at least comparable to last year.
regards
ACB
No, it's clear that there was an increased melt rate for two weeks in April that has brought us to where we are now. For now, the two lines are diverging in favour of a lower melt rate.THis is even clearer from the relevant graphs on the CT site.
Quite so. However last summer's warmth acted on an ice pack that had a rather higher proportion of thicker multi-year ice than is present this summer. It would follow, therefore (all other things being equal), first that a repetition of last summer's warmth would lead to a significantly lower minimum this year than last year, secondly that for this year's minimum to equal last year would not require such anomolous warmth.
On the evidence so far it looks highly likely that the minimum will be below that of 2006, the second lowest minimum after 2007, and probable that it will approach that of 2007.
regards
ACB
Actually at the moment things look much better than in 2006.
-
OK proper reply :
As regards global warming, I believe that....
even if it's mostly 'natural', it's still worth working towards sustainable living.
Which is the same as TWS.
-
As regards global warming , I believe that some would be good, I'm sick of freezing to death on Bournemouth beach every summer.
Prize (donated by Shuggee), a years supply of weetabix, or a years supply of Imodium, depending upon your bowel habits.
Mr S.
-
Even in the depths of the Antarctic winter Wilkins continues to fail
http://www.terradaily.com/reports/Even_The..._Shelf_999.html
Do check out the animation.
Mr S., do we think that the 'masks' placed over the sat images used to calculate sea ice area/extent are updated quickly enough to reflect the amount of open water that now exists where shelfs once sat? Seems to me that by just freezing over these areas you would get a larger 'ice extent' without any necessary 'growth' in ice levels?
Hi GW
I would say that if the shelf is continuing to break up in winter then most probably temperature isn't the cause.
I think the CT graphs are very useful as they cover a very large area and enable comparisons to be made back to 1979. The hypothetical phenomenon you refer to if it exists should have been in play throughout the period from 79, hence it is perfectly valid to compare now with the past 30 years
Mr S
Is it possible that the increase in ice volume is causing the natural calving process to accelerate, thus causing the break up of the ice shelf?I would say that this is a much more likely explanation.

 I think this debate is entertaining amateur stuff, end of. And I think the Met Office scientists are probably very good, it is the spin that comes out of the climate centre that is dubious, it's hardly balanced IMO.


 .
.


Latest Antarctic Ice Reports
in Spring Weather Discussion
Posted
I would now expect last years record area to be surpassed sometime in early to mid August, a full SIX WEEKS ahead of the time when the maximum is normally achieved. Amazing and sadly little reported.