


Ruben Amsterdam
-
Posts
132 -
Joined
-
Last visited
Content Type
Forums
Blogs
Gallery
Events
Learn About Weather and Meteorology
Community guides
Posts posted by Ruben Amsterdam
-
-
With January almost over, and February about to start, time is running out for any serious winter attemps (last March was something exceptional, we cannot assume that month will repeat itself any time soon). A reforming vortex at this point would most likely mean the end for any true winter aspirations. Allthoug a cold snap is always a possibility, of course. The next couple of days will therefore be very interesting stratospherically.
Because the last couple of GFS runs seem to differ wildy in FI (or UGKB in Dutch - after the German "UltraGlasKugelBereich"), I'm inclined to say it's anybody's game at this point. The critical point (at which the runs start to deviate wildly) appears to be around the +180hrs -- +192hrs mark now. A crucial point as +192 is where the high res. ends. Tomorrow's runs (both Berlin and GFS) will be very interesting indeed

Any news from the GEFS, Recretos?
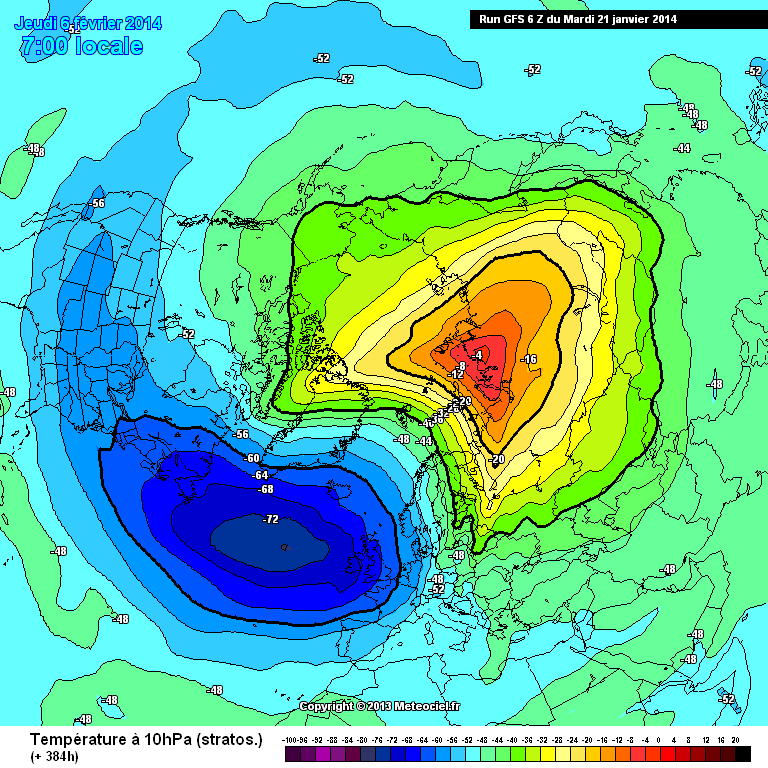
To end, todays 18z +192 chart shows a modest split at 10hPa (it splits earlier, actually). The million dollar question is: what will happen next? Gentleman, place your bets
-
 1
1
-
-
NAVGEM reduces the stratospheric vortex (at least temperature-wise) to zero every run in app. 120 hrs time. It's been that way for the entire season. Either the data uploaded to meteociel are corrupted, or the model just does not make sense.
-
2
-
-
A stab in the dark here Nick but I wonder if the uptick in solar output has been responsible for this?
10.7cm solar flux has been stable the last two/three weeks around 135 and expected to rise slightly the next couple of days.
I'm confident the 06z will boost moral again
​ -
ECM and GFS reasonably agree.
-
I know nothing about the strat in order to comment on it, but I pop in here now and again and look at some posts, and it seems to me that the warmings that show up always seem to be at the end of the run, and still aren't getting any closer?!
Or is this just me not seeing everything as I only have a look every couple of days??
It's not just you.
-
1
-
-
GFS12z verifies! Stuff just got interesting!
Edit: ok, not as impressive as the 06z at the end, but certainly not a bad run.
Edit edit: two ensembles (12z) made by Lars form our Belgain/Dutch forum weerwoord.be. 10 hpa zonal mean winds at 60N and 10hpa temps at 90N. I suspect the differences between operationals and members (early in the run) is due to resolution issues.-
2
-
-
I just love these graphs. So illustrative!
It strikes me as a rather large coincidence that GFS 06z with its downgraded/different tropospheric pattern (as opposed to previous runs) shows an excellent stratospheric run. Any major differences in terms of MT events between the 06z and 00z?
-
Decent Berlin run indeed! Also, the blue puddle of cold at 30hpa appears to warm slightly at +240 (finally!).
-
1
-
-
With the charts showing a cold outlook all of a sudden I would just like to ask what has caused these charts to show up on the nwp especially with all the negativity about the stratosphere at the moment?thanks.
Cold outlook? We currently have a split-like pattern in de lower stratosphere, which - in my view- is causing the Northerly high pressure areas and somewhat reduced westerlies. Or at least, allowing them to stay in place. The situation, however, is not favourable enough to support really cold patterns. One might say that the American core of the vortex is situated too far east/is too strong. The same pattern is present in the troposphere: the strong Alaskan high continously forces troughs and cold air to flow onto the Atlantic.
In the mean while, EC still does not forecast the intense warming GFS has been showing. That said, GFS seem to downgrade the warming in the last couple of runs.
-
1
-
-
I tend to agree with Matt, winter is well underway and yet all goodies are beyond +192. The GFS warming is inching closer, I guess, but I am still worried about EC not picking up the warming GFS has been showing for some time now.
GFS vs EC. Temperature difference is huge.
-
2
-
-
Pity the Alskan/Aleutian high lower down in the strat keeps fuelling the Greenland tropospheric westerlies. Hopefully the 30mb pressure profile soon matches the 1mb pattern at the end of this run (they are basicly mirror images at this point)
-
1
-
-
Lower down this correlates with the main part of the vortex over Greenland and therefore westerlies. In the long run (so even beyond this chart), beating up the vortex like this probably improves our chances ofc.gfsnh-10-384.png a part of Polar vortex over W England 2 weeks from now, hope it will give both Uk and Scandinavia cold weather, and i know it's far away but let a man dream okey!
-
1
-
-
The consistency in the gfs op fi modelling of the temp at 10 hpa is now catching my eye. i dont recall any of the previous modelled warmings this month and last showing the same pattern run after run at the T340+ timeframe. ed's date of the 5th might be a couple days early. shame on you !!
As long as EC is not joining GFS in the warming trend, I'd be very carefull.
-
2
-
-
Yes, GFS is playing Mr. Consistency again, but EC is not on board (temperature)!
Edit: again large differences between EC01-20 12z and GFS01-21 06z. Check out the difference at 1 hpa by the end of the month.
-
"The most notable thing is the large amount zonality and cyclonic energy in the Atlantic sector, pretty much all the way from the troposphere to the upper stratosphere."
I fear this is a bad thing?
Thnx for your great post btw!
-
No downgrade.
+4 Towards the centre
-12 But has pushed a good deal into the Arctic and is pressing on against the frozen core.
Todays 06z confirms this development. Funny, GFS was hinting on the strong Asian warming/displacement some days ago, only to switch to a more split-like evolution. Now GFS seems to have picked up on the displacement again and is actually looking pretty at high levels. Could this be due to tropospheric developments ie. MT events? Anyone?
-
Quiet sun ??
http://www.bbc.co.uk...onment-25743806
"This means that less UV radiation hits the stratosphere - the layer of air that sits high above the Earth. And this in turn feeds into the jet stream - the fast-flowing air current in the upper atmosphere that can drive the weather."
"The era of solar inactivity in the 17th Century coincided with a period of bitterly cold winters in Europe."
Any comments??
Well, perhaps slightly off-topic here. In paleoclimate, changes in solar irradiative forcing are the main driver behind climate change on the long term (ice ages, interglacials, etc) with CO2 following warming. This is mainly due to Milankovitch cycling, not to the 11-year solar cycle. When compared to anthropogenic factors, the variation in radiative forcing caused by the 11-year cycle is relatively minor. On a global scale that is (see graph below from IPCC5).
On the other hand, climate and paleoclimate is not the same as weather and we may -as the article describes- see a local effect of low solar activity in Europe. I'm not sure if the colder winters in Europe (it sparked the imagination of many painters here in the Netherlands) can actually be explained by reduced zonality in the stratosphere. I am not aware of any papers referring to this and to my knowledge this has not been included in climate models. But, as our planet continues to warm, the effect of reduced solar activity may be mitigated to some extend.
-
4
-
-
Can this potential ST warming give some cold to Scandinavia the first week in February?And with that i mean temperatures below -15° daytime even in south Sweden / Denmark?
Isn't it freezing cold already in Scandinavia (in Dutch we say "the stones freeze out of the ground" or "it freezes so hard, it cracks")? Even if we were sure favourable stratosphere model predictions verified, we would be unable to answer this question in this time-frame, mainly due to variability in the troposphere. Remember that the stratospheric charts shown here are all model output and by no means fixed boundary conditions/input (like solar activity, orography, or SSTs, for instance) for the models.
@blizzard: we move from displacement to split and back again. Every run is a different story. Some with happy endings for us, others with a happy ending for the vortex.
-
1
-
-
So, any thoughts on the recent GFS runs? Asian warming/wave-1 seems unable to force the vortex of the pole completely, me thinks. Some runs (like the 18z) pick up on wave-2 afterwards, splitting the vortex. Other runs continue the wave-1 attack while keeping the vortex mostly intact.
Any thoughts on what is causing this run-to-run inconsistency?
-
Like the Berlin output. Zonal winds low down look great and the strat split as high as 20hpa late on . Would be nice to see that repeat, especially when we have a monster depression headed east at the same timescale (could do with that hitting ed's invisible split vortex brick wall!)
Yes, very encouraging with a nice split in the lower strat. Although wave-2 activity is deminishing overall, wave-2 is still active/present in the lower strat/trop. In fact, it may be the highest wave-2 activity lower down I have seen this winter.
-
1
-
-
is that a split vortex we are looking at on the 06z GFS at 384hrs?
A very shortlived split (ish) signature at 100hPa just before this trop chart. At these levels the stratosphere is severly influenced by the troposphere and in my view it's way too early to search for splits at the >100hPa level. The tropospheric (especially in lower levels) output varies wildy from run to run after the Asian warming currently peaking at ~300hrs. Will we see the Asian warming ramp up, or do we switch to a wave-2 pattern? Too early to tell and frankly, I am waiting for the Asian warming to show up in the Berlin graphs before making any calls on the lower strat. Btw: upper strat temperatures significantly lower this morning when compared to the previous GFS runs.
-
A reccuring feature - I think - is a strong Alaskan high (see latest EC op). To what extend does this influence the MT events we talk about?
Edit: close to reversal at 1hpa? Max temp at this level is +42C!
-
I was also hoping for pony but in the end I just got whatever Santa left under the tree.
Santa isn't real - blame your parents
-
1
-
-
Warming over asia not as strong on the 6z but then there is this little feature that pops up over the UK in deepest FI to give another kick.
I'm hoping for the strong Asian event to return in the evening runs. The above is nothing but yet another delay.


 ​
​ 


Stratosphere Temperature Watch 2013/2014
in Spring Weather Discussion
Posted · Edited by Ruben Amsterdam
In general today's Berlin charts do not look too bad with zonal winds clearly on the decline on 1, 10 and 30 hPa. Fluxes are strong and the strongest u-change due to EPV of the season if this verifies.
In the mean while, we see temperatures increase.
Allthough wave-activity is decreasing in the upper stratosphere, wave-1 remains strong at 30hPa.
The 10hPa charts show a decent split and associated warmings (indicative of wave breaking?).
The only true downside is the pattern at 30 hPa. The vortex remains pinned - even after it is split- over Greenland and does not show any signs of moving elsewhere.