


KyleHenry
-
Posts
304 -
Joined
-
Last visited
Content Type
Forums
Blogs
Gallery
Events
Learn About Weather and Meteorology
Community guides
Posts posted by KyleHenry
-
-
Agreed all models show the Canadian PV roll back into place,combine that with warm North Atlanic SST, west based QBO allows the pattern to continue with low pressures and heavy rainfall. Similar pattern so far this winter to last but with rainfall further south.Main thing that strikes me this morning is the fact that the PV seem's to be getting more and more reorganised over Greenland, If it carries on we could end up with yet another repeat of the endless storms crossing the UK> . There really looks like no end in sight, even the pressure rise ideas are now dead in the water. I think we will end up with a UK wide sink hole problem if models carry predicting what they are , ground water levels can't take much more..

GFS @ 10 hPa signal a possible wave for beginning of March. If it occurrs and if it is large enough to propagate to lower Trop. Then ten days into March for next possible break in pattern which is a long wait.
At present no high pressure has any chance to get a foothold in NW Europe in any direction.
-
 1
1
-
-
The ECM 12z at 240 hours as always shows a teaser with a 1030 mb high pressure over Svalbard until it comes into a reliable time frame not much can be said about it. Then the question of how it stands up the rolling mauls of low pressures coming of the Canadian PV can be answered.
Apologies to all those who's sanity can't hack another go lol
-
5
-
-
GFS 12z 156 hours shows the other side of the coin with the formation of a true Greenland high which in turn if it occurs with allow the Russian cold time to move in and strengthen while it slows down the Canadian PV low pressure train.http://modeles.meteociel.fr/modeles/gem/runs/2014021412/gemnh-0-156.png?12 Updated GEM ( close but no cigar ) & NAVGEM going the same way. S
-
I'm no expert, my best guess would be the combination of the PV and the warm AMO. PV spawns the low and warm upwelling of water in Atlantic supercharges the lows. Ridging cannot force its way through the conveyor belt. Question if anyone knows ? Can slight wave /warming at the 10 hPA level, allow a way to forecast high pressure ridges and placement in the lower Troposphere. Where we see slight warming/waves and not the stronger waves that go all the way up to the 1 hPa level . High pressure ridges seem to form in those areas.Can anyone explain why we have such low heights covering such a large area from the great lakes through to west Russia - with no ridge in sight! whereas we have a strong ridge over Siberia - a shallow trough over sea of japan/okhost followed by another large high over north pacific and a low to sw of Alaska and then another ridge over north Canada.. the ridge trough pattern is evidence on one half of the northern hemisphere but not this side- its an unusual state of affairs it has to be said.......
-
ECM 12z Anomalies chart N Hem at 240 hours show the complete retreat of the Aleutian high. PV still strong and still throwing out Low pressure systems at us mostly towards the West parts of the UK. http://www.meteociel.fr/modeles/ecmwf.php?ech=72&mode=1&map=1&type=0&archive=0
A day without rain up here sends us into shock so we can take it, 300 days a year of it, the trick is Whisky osmosis.
Good signs for the South East with a dry out from the continental High showing, but unfortunately doesn't look the same for the SW as it continues to get clipped from lows going through. Although not as severe.
Met office are right again with the split NW/SE
The pattern looks to continue in the vain of Winter 89/90.
Three days of wintery weather looking good for the start of next week.
Poor winter for snow lovers but it's a necessary evil to endure and possibly again next winter due to warm AMO phase that were in. Warm Atlantic creating so much energy as seen thus far.
-
1
-
-
A quick look at Ozone Dobson units and placement for Winter 2013/14. Low amounts measured and all contained above Siberia towards the Bering Sea. http://ozonewatch.gsfc.nasa.gov/Scripts/big_image.php?date=2014-02&hem=N
Also North Atlantic where current wave is showing.
The closest comparison I see to this pattern from the satellite era records is Winter 1989/90
http://ozonewatch.gsfc.nasa.gov/Scripts/big_image.php?date=1988-02&hem=N.
Would it surprise anyone that Winter 1989/90 was in the top ten mildest re CET and top 3 wettest since records began.
It did have a dry sunny Spring for England and Wales.
An educated guess for the next wave would say North East Asia/ Bering Sea. As Recretos states above, unlikely any down welling to lower Troposphere from next wave either.
ENSO predicted to remain slightly above neutral towards El Niño until summer.
http://www.cpc.ncep.noaa.gov/products/analysis_monitoring/enso_advisory/ensodisc.html.
Feelings of possible La Niña towards the end of year.
-
2
-
-
We've got to go all the way out to ten days on the ECM 18z- Anomaly 500 - 240 chart http://www.meteociel.fr/modeles/ecmwf.php?ech=72&mode=101&map=1&type=0&archive=0
To see any type of possible break in current conditions. Signs of the worlds biggest plug the upstream Alaskan/Kamchatka High begins to dissipate South .
Only here do we see weak heights forming above Baffin Island and push the main vortex poleward . As I say it's ten days away, realistically outcome is low at present unless a trend appears over the next three days.
That's the only crumb I see.
-
If only lol http://www.meteociel.fr/ukmo/runs/2014020100/UW144-7.GIF?01-06
Signs of some room for the Azores to go up the GIN corridor http://www.meteociel.fr/modeles/ecmwf.php?ech=72&mode=1&map=1&type=0&archive=0
As always 10 days away but it is there
-
Wave 2 effects are scheduled to begin tomorrow on the GFS 18z
http://www.Meteociel.fr/modeles/gfse_cartes.php?&ech=12&mode=10&carte=1
GFS then shows 7 days later wave 2 at 10 hPa level peaking impressively
http://www.meteociel.fr/modeles/gfse_cartes.php?&ech=192&mode=10&carte=1
GFS picked up the signal for wave 1 from a long range and pin pointed the area with high precision. Same can be said for wave 2 in placement and distance also.
I see some on the model discussion thread looking at one chart in isolation with no comparison and see no wave on that day of looking. Then write off the forecasted wave.
For it to appear again the next day.
As for wave 2, if it verifies at current strength then the Northern Hemisphere will go further into flux that it already is.
No patronising meant in my post to all those here with more knowledge then myself. Felt it had to be said.
-
The GFS 12z @ 120 hours precipitation chart shows what Mr Murr was talking about
http://www.meteociel.fr/modeles/gfse_cartes.php?&ech=120&mode=2
The snow moving in from the North Sea .
But as the MO and Ian Ferguson state correctly it will just be short lived before temps rise again, close to or around average for late Jan early Feb.
What comes after in 10 to 15 days is where we hope for a significant blocking scenario to the UK. Nick Sussex will be first to point out when and if it will occur.
It's all good, first taste of winter proper since last April 2013
-
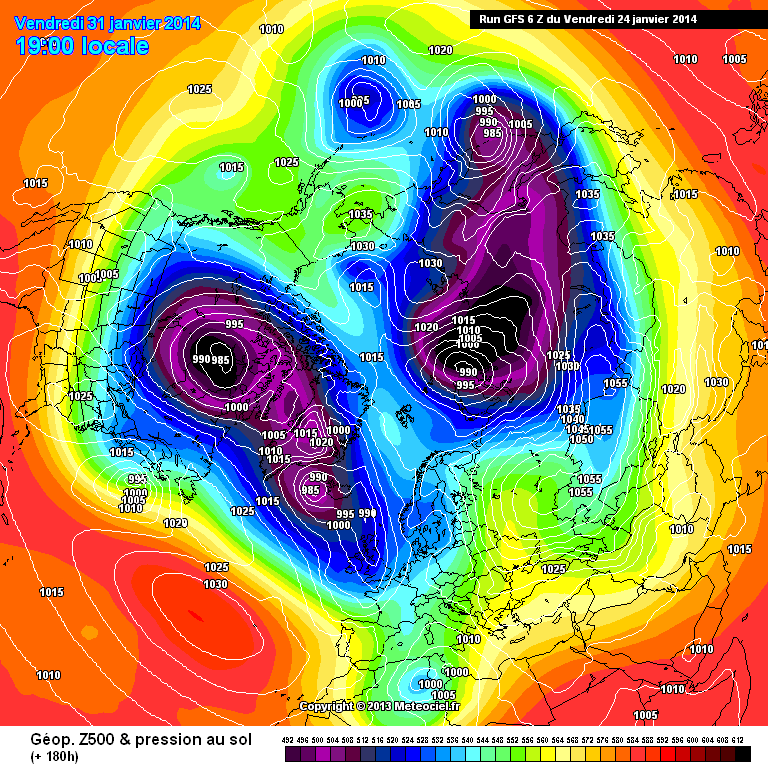
Well If you take the fact the GFS is poor in blocked scenarios, the fact it has a eastward bias , The fact that it models 850's to high to the east, the fact its the 06z then your left with probably the most eastward solution.
http://modeles.meteociel.fr/modeles/gfs/runs/2014012406/gfsnh-0-180.png?6
pretty good there.
Who wants a virtual sportsmans bet that the slider doesn't get east past Ireland......
Steve I'm in the best position to take that virtual bet. I could even give a live commentary of the slider going through over my head at 144 hrs and in turn you could let us now how the -8 uppers are, as they nose into the East coast
-
GFS 18z at the 10hPa level temps peak on the 28th Jan @ -24 C with wave 1. But wave 2 pops up like a ninja two days later with -16c temps above the Ukraine (unless all the rioting and burning tyres has done this) The GFS has been showing temp rises intermittently for a month now over both areas.
-
2
-
-
These comments from NCEP might show that perhaps all is not as it seems:
FORECAST SPREAD DOES INCREASE BY NEXT MIDWEEK WITH
PACIFIC ENERGY TRYING TO WORK INTO THE WRN PERIPHERY OF THE RIDGE
AND EMBEDDED SYSTEM FLOW SPECIFICS DROPPING THROUGH CANADA TO THE
LEE OF THE RIDGE. HOWEVER A RECENT TREND HAS BEEN THAT NEWER
MODEL AND ENSEMBLE RUNS HAVE BEEN FINDING WAYS OF MAINTAINING THE
RIDGE LONGER THAN PRIOR GUIDANCE. THIS WOULD PROLONG THE
ANOMALOUSLY DRY PATTERN THAT HAS BEEN IN PLACE ACROSS THE WRN US
THIS SEASON...ALBEIT EVEN WITH SOME LIMITED PCPN WORKING INTO THE
PAC NW AND NRN ROCKIES.
Looking at all the models that are showing the upstream pattern in the Northern Hemisphere from 144 hours all the way out towards FI you got that feeling too. Until the PAC ridge sinks the Canadian Vortex can't track Eastwards which I do think it will. But it it will take longer to do so say 10-15 days. Then the AZ can be less influential and allow the cold Siberian/ continental uppers the move closer to the UK. I feel it's still a strong possibility just needs a little longer than most can probably hold out for. Fingers crossed.
-
8
-
-
Northern Hemispheric winter 2013/14 is following a similar pattern to winter 2012/13 with a late winter early spring below average temps for the British Isles.
Polar vortex has been recording extremely low Strat temps from 30 hPa all the way to the 1hPa level, as SK says 'the beast'. Following all the Strat charts from the end of December 2013 to present, the temps has recovered to just above the mean as shown by S4lancia's post above.
Now we see the split occur in the Vortex. Heart breaking for those that wanted a white Christmas. When those of us that follow the Strat temps could see that it was always going to be a very low probability with the strength of the PV.
Since late December 2013 from just observing say the GFS 10 hPa daily charts for the Strat temps and not looking ahead for the SSW.
The warming has been circumnavigating around the PV slowly chipping away until we get to our current PV split. Just like the defeat of General Custer at the battle of the Little Big Horn, circle the wagons idea.
-
Battle of the giants. ECM 0z @ 240 hours is where everything hinges on to get something really special regarding cold to the UK . The Azores High verses the Canadian Polar Vortex who will win?
-
These kind of products are good when you are trying to pin-point where a model might make the SSW "contact" with the troposphere. To be fully honest, I am testing all these products mainly for the next season (14/15) which should be one bomb of a season of strat. monitoring, and where all of the products I am testing with at the moment the next season (14/15) which should be one bomb of a season of strat. monitoring, and where all of the products I am testing with at the moment, might prove they are actually helpful with forecasting possible SSW induced effects (where and when), if one might occur.
The futures bright the future is Recretos. I, like everyone else wish you success in your future plans of predicting precise effects and placements to the lower Troposphere from a SSW. Between Chionomanic the Strat Oracle and Recretos I think you have the entire Strat puzzle nearly sussed. Business partnership in the making ?
-
1
-
-
[quote name="emotional rollercoaster" post="2900364"
as I said earlier lows and azores interacting to give a total flat zonal with jet screaming at us with low pressure steam rolling through into ne Europe.
Azores is looking for the GIN
-
2
-
-
For all those that see the AH on the GFS 12z and the ECM 6z and especially on the UKMO 12z at 120 hours pushing into the UK and feel despair and see no way out Try to see why this is happening. Say you were to change from looking at the West Europe model maps and look at the Northern Hemisphere model maps on Meteociel. Then say you looked at the Alaskan US border region and observed the WAA pushing warm Pacific air all the way up to the edge of the Arctic Circle. Common sense says the Canadian Vortex goes Eastwards and pushes the Scandi HP east also allowing the Azores High into the British Isles , as there's space to move into. What happens when the warm air /WAA dissipates and goes South again. A person might say the Canadian Vortex would move Westwards again allowing the Scandi back in. Azores to track westwards. After that it's anyone's guess. Questions of can the Azores High push up to Greenland. Will the Arctic High sink or will Scandi High push West. No malice meant in my post. I see the Alaskan WAA as the cornerstone of everything happening in conjunction with the slow and continuous warming of Stratosphere since late December 2013. What the SSW will do I can't say. Send everyone bonkers most likely.
Disclaimer: if above is wrong then my 45 IQ rating is justified lol
-
4
-
-
UKMO 0z shows Scandi high put under intense pressure and pushes it SE but it still hangs on and gingerly reforms by 144 hrs. GFS 0z shows the same. All this from the WAA up the west coast of US which keeps the Arctic high 1040 mb directly over the pole. Naturally the PV is split and sends the Canadian vortex towards Greenland. UK takes a hit from NE edge of AH raising temps. GFS 0z shows the jet stream move north of UK, then straight at us. The jet stream pushes the Siberian Lobe far to the east. GFS shows the jet stream dissipate which will allow the coldest temps to back westward again. At a guess seven days to move back into Eastern/ Central Europe for start of Feb. It's then all about the Canadian Lobe, AH and Arctic high pressure. Westward movement of the Canadian lobe is logical after the WAA dissipates. AH to sink and follow lobe west and Arctic high to move South. Bobs your uncle. Greenland high, northerly then blocked easterly= heavy snow for 6th Feb. Going way beyond even FI has no fear for me lol
Or instead send an Atlantic WAA all the way up to the Arctic high like the ECM 0z does at 240 hours. The models are amazing to watch at present
-
1
-
-
Please correct me if I'm wrong and being too simplistic, current total ozone observations are peaking in Stratosphere from Central Asia to Kamchatka. Exactly where the GFS is signalling a dare I say it,SSW with a Himalayan Mountain Torque event. I say this, because this years first wave 1 and 2 at the start of the year followed the similar area pattern. At a guess does the peaking of stratospheric ozone open the window for warming to occur before the ozone heads south for the Southern Hemispheric winter. If the SSW does occur then seven days into February 2014 would be my call for UK change. The complexity of all factors involved are mind boggling to predict correct outcome for which I do salute all your efforts and work in this thread.
-
2
-


Stratosphere Temperature Watch 2013/2014
in Spring Weather Discussion
Posted
http://ozonewatch.gsfc.nasa.gov/Scripts/big_image.php?date=2014-02-21&hem=N
Effect should split the PV Gino.