


jcw
-
Posts
38 -
Joined
-
Last visited
Content Type
Forums
Blogs
Gallery
Events
Learn About Weather and Meteorology
Community guides
Posts posted by jcw
-
-
5 minutes ago, Mike Poole said:
As far as I know, that’s the only one there’s been! Fair play to Mr Bartlett for getting his name immortalised on the back of a one off weather pattern!
The Bartlett definition. I saved this from the UK.sci.weather newsgroup some years back. Written by another poster at that time.
"However, in recent years (this written in autumn, 2005), these situations have been notable by their absence. What 'high' blocks there have been stay teasingly just too far east and more often than not, a broad band of high pressure extends from the Azores area, east-north-eastwards towards the Biscay / English Channel region - perhaps now & then displaced towards the Alps, as storm upon storms weeps in from the North Atlantic, hurried along by an often powerful upper jet. Rain, gales and above average temperatures prevail, with any 'wintry' weather confined to brief incursions of Polar Maritime west or WNW'lies, or perhaps a temporary Arctic Maritime blast from the north - which is shunted away as the next surge of mild air hurries in from the west. The apparently semi-permanent belt of high-pressure in the 'wrong' place has been christened ... "The Bartlett High", in honour of Paul Bartlett, a luminary of this ng, who used to put his experience of forecasting to the test by publishing a reasoned winter forecast for all to see. As Les Crossan has noted (also a stalwart of this ng), this has come to be regarded as a 'slug' - nothing moves it, not even extracting a pair of dividers and skeweringthe said beast as it sits dominating any particular synoptic chart! "
-
 1
1
-
-
5 hours ago, Downburst said:
Due to the wonders of AI I was able to find the google thread from the extraordinary winter of 1998 when Paul Bartlett came into the meteorological lexicon with his, as you will see a poster call it "Bartlett High" Well worth a scan, believe it or not that's over a quarter of century ago. They even muse over whether it will be coined. Plus the style of internet posting and quality was of course entirely different then, oh how times have changed.
https://groups.google.com/g/uk.sci.weather/c/OWaVXlmYlis/m/cskUin3H5kAJ
Yup, thanks for that memory - I posted on uk.sci.weather around that time too - learning much from the likes of PAul B, Will Hand, Mike Tullet and others. Some great characters (trolls or otherwise!).
IIRC, the High was also referred to as "the slug".
Joe
-
 6
6
-
-
2 hours ago, CoventryWeather said:
Don't know how true it is, but recent discussions on the winter thread are stating about this period of weather is very similar to that of November 2009. If so, does anyone remember what the winter was like, as it seems to be something that people are thinking could be similar this year.
Further to previous post, here's a summary of the 2009/2010 winter from the same source. Any typos are mine as I tried to transcribe from original document!
"COLDEST WINTER FOR BETWEEN 13 AND 18 YEARS IN PLACES
Mean air temperatures for the season were around two degrees lower than average for the 1961-90 period and it was the coldest winter since 1962/3 everywhere. The season began with relatively mild weather, but each of the winter months was colder than normal. The season's lowest temperatures were measured in the periods December 24th to 25th and January 7th to 9th, when air temperatures fell below -10°C in places and several stations recorded their lowest winter values for more than 20 years. There was a total of between 70 and 80 ground frosts during the season at inland stations, while Valentia Observatory's total of 62 ground frosts was almost three times its average winter figure of 22.
Rainfall totals (including snowfall) for the season were below normal almost everywhere, with only around half of the seasonal totals recorded in some places. At most stations it was not as dry as the winter of
2005/ 6, but at Shannon Airport it was the driest since 1963/4.111e season's heaviest falls were during December and mid-January particularly on December 29/30 and on January 12 the south. There were between 20 and 30 days with snow ill many places, mainly in the form of showers, but snowfall accumulations were generally slight except high ground. The total number of raindays during the 3- month period was between 44 and 62 generally, around 1 O% lower than normal for the season.
Sunshine totals for the season were above normal everywhere and they were exceptionally high in the west and south, It was the sunniest winter 011 record at stations in these areas, including Valentia Observatory, where over a century of sunshine records exist. Another notable feature of the winter's weather was the infrequency of strong winds. Mean wind speeds for the season of between 5 and 11 knots (9and 20km/ h) were below normal everywhere and were the lowest on record for winter at many stations. The highest gust of the season, 62 knots (115km/ h) was measured at Valentia Observatory on January 12."
-
1
-
1
-
-
2 hours ago, CoventryWeather said:
Don't know how true it is, but recent discussions on the winter thread are stating about this period of weather is very similar to that of November 2009. If so, does anyone remember what the winter was like, as it seems to be something that people are thinking could be similar this year.
This from Met Eireann records...
2009 November
(Source: Met Eireann monthly weather bulletin - https://www.met.ie/climate/past-weather-statements)
Atlantic depressions passing close to Ireland brought wet and windy conditions throughout almost all of November, continuing a pattern of very unsettled weather over Ireland that began in mid-October. Persistent and often heavy rain over this period led to unprecedented levels of flooding in parts of the west and south, as ground conditions became saturated. Rainfall totals for November were the highest on record at most stations, including the long-term stations at Malin Head and Valentia Observatory, where records extend back over 100 years.
Valentia’s total of 345mm was its highest of any month since observations began in the area in 1866, while its previous highest annual total of 1923mm in 2002 was also exceeded during the last week of this month, reflecting the persistence of wet weather throughout the year. More than twice the average November amounts were measured at almost all stations and over three times the normal amount fell in some places.
Rain or showers were recorded on almost every day, with between 22 and 27 wet days observed (days with 1mm or more rainfall), compared with the normal range for November of between 13 and 20 wet days. Heaviest daily falls at most stations were recorded on the 1st, in the period 16th to 19th, and on the 29th in the east; two-day falls of over 100mm were recorded in parts of the west and southwest on the 18th/19th (see below). Much of November was mild with little or no frost, but temperatures fell considerably towards the end of the month.
Overall, mean air temperatures were close to a degree higher than normal generally. Air and ground frost became widespread at the end of the month, but the total of between seven and 12 ground frosts at inland stations was below normal for November.
Despite the very wet weather, sunshine totals were above normal generally, especially in the south and northwest. 1st to 26th: A series of fast-moving deep Atlantic depressions brought active frontal systems across Ireland, bringing very wet and windy conditions. Spells of rain or showers gave falls of 10mm or more on many days across Connacht and Munster, while all areas received heavy falls on the 1st, 9th, in the period 16th to 19th and on the 21st. River levels reached record heights in many parts of the midlands, west and south, leading to significant flooding. The strong south to southwesterly winds for most of the period brought mild conditions, although slacker winds and clear skies allowed frost to form in midland and eastern areas between the 8th and 11th.
A depression of central pressure 954hPa off the west coast on the 21st/22nd generated storm conditions, with very high seas. 27th to 30th: Low pressure became centred to the east of Ireland, bringing a cold northerly airstream across the country. Showers in western areas died out, but a spell of heavy rain in eastern areas brought flooding here on the 29th. Both maximum and minimum temperatures were below normal, with frost becoming widespread.
-
3
-
1
-
-
2 hours ago, Downburst said:
Love this chart. That is a great signal from July 7 to the end of the run. Lets watch this. Do you mind sharing the link?
This work for you?
*Edit: display as link*
 ECMWF | Charts
CHARTS.ECMWF.INT
ECMWF | Charts
CHARTS.ECMWF.INT-
 1
1
-
-
12 hours ago, Anthony Burden said:
Hi perhaps you could read Marco Patanga blog on Twitter a meteorologist from the met office,from which I took this information from.
While not challenging Marc's views there is a very extensive analysis from Simon Lee which may inform further...
Simon’s Stratosphere Watch #2 | Simon Lee
SIMONLEEWX.COMWhen I wrote the first SSW blog on the evening of Tuesday 22 February, I did not expect to be writing the next one so soon after with such increased uncertainty. But there are many aspects to the way...-
2
-
-
On 03/02/2021 at 00:02, Allseasons-si said:
I am surprised no one posted the JMA strat graphs,..another warming on the way?

I did see @Petagna (Marco Petagna, Uk Met office) comment on this yesterday:
"The latest round of warming in stratosphere above N Pole appears to be coming to end at 10hpa.
Notable extension of warmth observed down to the 30hpa #pressure level this time.
The E'ly #SPV stratospheric polar vortex looks set to revert W today..strong vortex recovery in sight"
Joe
-
15 minutes ago, nick sussex said:
I think they’ve already gone through the alphabet once so this is now alphabet part 2 .
Don't think so, Nick.
The storm names came into effect on Sept 1, 2020 - ignoring storms named by Portugal, France or Spain, or ex-Hurricanes.
The 2020/2021 names storms are here:
Storm Names 2020/21 - Met Éireann - The Irish Meteorological Service
WWW.MET.IEMet Éireann, the Irish National Meteorological Service, is the leading provider of weather information and related services for Ireland.-
1
-
-
4 minutes ago, Snow lover 2020 said:
It’s all lies. Delete this now!
Lol! Says who?
-
2
-
-
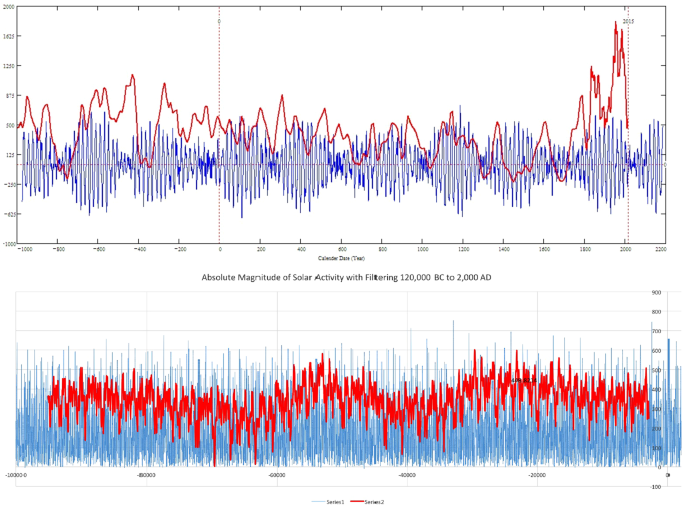
6 minutes ago, Snow lover 2020 said:
Show me how it’s been proven wrong? And no are you stupid? The solar cycles are getting less and less., if you refer to the charts of the solar every 10 years. It’s the lowest it’s been since Maunder Minimum in 1600s! River Thames froze over during this period. We’ll see who’s right in 10 years
Here's something you might read too.
The ‘Mini Ice Age’ Hoopla Is A Giant Failure Of Science Communication
WWW.IFLSCIENCE.COMThis month there’s been a hoopla about a mini ice age, and unfortunately it tells us more about failures of science communication than the climate.Zarkhova, the primary source for the Grand Solar Minimum touted by the media, never actually suggested this in the first place. In fact it was only after the media hopped on her research and hyped the story suggesting connection to climate change and the Maunder minimum that Zarkhova even thought to consider a link there.
Scientific peer review has offered no such outcome that I've seen but I'd welcome direction to any if it's there. I'd prefer to choose the scientific community over elements of the media, or other websites/individuals that have little or no recognisable qualification that gives them credibility. They simply relay these stories - it makes fun reading and generates hits.
I'm open to research that provides credible backup to a position - I've not found any yet to support the view you've presented.
-
2
-
-
7 minutes ago, Snow lover 2020 said:
No an SSW has been talked about last few days. Where have you been? Lol it develops end of December
Unfortunately talking about an SSW doesn't make it happen.
Useful to keep an eye on charts like this to see if there's any hint of a warming ahead...
http://ds.data.jma.go.jp/tcc/tcc/products/clisys/STRAT/gif/pole30_nh.gif
-
2
-
-
3 minutes ago, Snow lover 2020 said:
All I’m saying is, I personally think that link of data is probably messed with to feed agenda but we won’t go there... let’s stay on topic my friend. adapt2030 has over 100k subs. He’s doing pretty well.
Popularity is not a measure of sensibility or credibility, my friend. Look to the President of the US with millions of followers.
I'm just saying, balance your research before making what are viewed as "wild" claims in the face of current research & science (and supported by 000's more than the subscribers to Adapt2030). It's not a popularity contest - it's science, facts, research and by many qualified people.
Stay safe
-
8
-
-
58 minutes ago, Snow lover 2020 said:
Watch @adapt2030 on YouTube. He will tell you all and look up “grand solar minimum” by valentina zharkova. We already know past grand solar minimums dropped global temperatures in northern hemisphere. Future winters may get interesting! Time will tell...
You mean this Valentina Zharkova? Some more recent reading material which suggests otherwise?
Hope David DuByne (@adapt2030) is prepared to continue his research and consider this paper too.......
RETRACTED ARTICLE: Oscillations of the baseline of solar magnetic field and solar irradiance on a millennial timescale | Scientific Reports
WWW.NATURE.COMRecently discovered long-term oscillations of the solar background magnetic field associated with double dynamo waves generated in... -
57 minutes ago, Snow lover 2020 said:
We are actually going into a grand solar minimum 2020-2050 and will cool down the world similar to Maunder Minimum with cold harsh winters by 2028! It’s a 400 year cycle. Yes global warming may be real and will resume once this cycle is over.
...and this is supported by what science or reputable sources?
-
2
-
-
2 hours ago, Penrith Snow said:
Hi, could someone please post a link to the excellent Wetterzentrale model output site as mine no longer works.
Cheers,
Andy
https://www.wetterzentrale.de/en/panels.php?model=ecm&var=1&map=1&lid=OP
-
I didn't think the a Hurricane can cause a buckle to the Jetstream (from papers I had read will try and find them again). Isn't it a case of the buckled Jetstream being the driver to the track of the Hurricane?
Either way, @mb018538, as you say, we're on the wrong side of the Jet next week and it's going to be a shock to the system, relative to what we've been experiencing..
Joe
-
3 minutes ago, northwestsnow said:
Nope, NI does OK, far enough north i guess..
As charts stand, based on GFS dew points and my own read of them, I'd be very surprised to see snow at low level along East coast and across NI.
Definitely making for interesting forecasts and model watching...
Still much to learn from this situation and I'll be watching how it pans out for sure.
-
2 minutes ago, booferking said:
Zero rain and fog as far as i could see the far North shows some snow Saturday but highly unlikely i would say it being right as dew points looked to high..
Agreed. No snow; more rain. Dew points look no lower than 4c at best. Any "battle" is the other side of the Irish sea.
-
1
-
-
3 minutes ago, fromey said:
This is a positive going forward, a way to go but going in the right direction
Yah, it's good...but not quite Carlsberg I'd prefer to see a spike here
-
1
-
-
52 minutes ago, Steve Murr said:
The isoline thats in England traces back to Scandi.
Small observation and for my own sake and understanding (or misunderstanding as case may be) isn't that chart showing the isoline that's in Scandi traces BACK to England? That's a weak anticyclonic feature going clockwise from a view of the wider chart?
JC
-
1
-
1
-
-
33 minutes ago, snowray said:
Yh, sorry there John, I should have said British Isles or UK. Anyway UK is about 243,000 km, Greece is just under 132,000 km. if we were to include the Irish republic as part of the British Isles that figure would be a lot higher of course. But then the Greeks may argue about Greater Greece and the Eastern Roman provinces of Byzantium, I think that some still lay claim to the city of Constantinople for example, now that is entirely another matter.
Edit. Just noticed England on its own is smaller than Greece, 130,000 km. That has surprised me but thought it would be close.
Spot the difference there at just D4 on the 12z.
Pedant time...Ireland IS part of the British Isles. Maybe you meant Great Britain?
I like the idea of an early to mid-March over western British Isles, at least.
While I love the thought of a snowy day, once we are into March, I'm more inclined to favour the advent of milder Spring temperatures than belated cold and snow.
J.
-
1
-
-
Looks to me, based on those charts, as if much hinges on T+150 and that that shortwave development (or not). As others say, thereafter the changes are notable from what we've seen on the 06z.
-
Not totally true as drifts over 7-10 foot high were a feature in many inland areas, certainly in my home area around Chesterfield, off and on from early January into March.
I can't put my finger on it just now but there are a couple of web sites with lots of details about the 47 and 62-63 winters, one complete with charts. Give Google a try?
Mike Tullet kept some great records before he passed away. Try http://myweb.tiscali.co.uk/mtullett/1962-63/
Joe
-
I would like them to say...."There are no strong signals so therefore we don't know"...............................................................
Well if that's you what you infer from that forecast while I infer that average weather is very likely, why not leave it like that, i.e. for people to infer for themselves what they want from the forecast? You're happy; I'm happy...ish...! It's weather.....almost unpredictable!!
joe


Model Output Discussion - Into 2024
in Forecast Model Discussion
Posted
Well said. Evidence will build, one way or the other, as this science continues to be studied. It's too easy, and too early, to dismiss it out of hand.
J.