


Midlands Ice Age
-
Posts
7,136 -
Joined
-
Last visited
-
Days Won
6
Content Type
Forums
Blogs
Gallery
Events
Learn About Weather and Meteorology
Community guides
Posts posted by Midlands Ice Age
-
-
22 minutes ago, Drifter said:
I do find the funereal atmosphere towards the cold spell quite amusing when it hasn’t even started yet!
I’m sure a good number of you will have some pleasant surprises this week.
At the end of a long series of posts...
One thing seems to have been missed in the above reviews,,,
That if indeed as the later more progressive model runs are developing less high pressure (I wont call it low pressure just yet) to the North, then this will encourage the low to the SW to move on a more northerly track than was expected, with resultant snowfall further into southern England..
If the high to the north remains then this will encourage retention of the colder drier weather, over southern UK as it will indeed push the low further south..
PS I've just seen the MO and Met and Der reviews....
MIA
-
 4
4
-
-
- Popular Post
- Popular Post
43 minutes ago, Iceni said:To summarise - you cannot model a chaotic system. Stock Market is the same.
Whilst I understand what you are saying....
If you can get down to the physics (maybe chemistry) then that also ought to be possible.
Summary - we are no where near there yet from a 'software' point of view.
I have spent much time looking at 'the weather' since retiring (It has always been a big interest), and some of the characteristics closely resemble share dealing systems, with apparently 'outside' influence having a large impact. Is this the same as a random 'butterfly' effect in our hobby/ pasttime?.
Also, I did spend sometime working on share-dealing and trading systems, which I put to use when I retired. (more good, though some bad), and/but they do also follow 'weekly' trends, which need to be built in the standard share models.
Anyway probably enough on this sort of topic before the afternoon fun and games begin.
MIA
-
13
-
1 hour ago, Derecho said:
Derecho...
30 years of modelling, programming , analysis, technology design and implementation has left its scars on me.
Twenty years ago we needed more machine power.
Now, unless we sort out the assumptions and get them analysed correctly into mathematics we will only magnify the errors as we push ever deeper into being able to look at ever more local detail.
Tamara is showing where some of the current assumptions are wrong, or at least give a totally different view. .
People on here showed how the stratosphere could affect things greatly. (10 years ago) This was incorporated into the models (though I believe is now possibly over responsive (see below)).
The only people to gain by increasing the computing power right now are 1) computer salesmen, and 2) system design specialists who have no further ideas as to how to improve the current models.
Incorrect assumptions ALWAYS increase volatility in output. Increased computing power will only serve to show up any design errors.
I appreciate that increasing the spread by the changing the input criteria, is one method of reducing any errors. But the initial 'errors' are still present, and will only serve to produce more chaos.
I am talking about from where the models are standing today (which is much better than they were 5-10 years ago). Spending hundreds of millions on more computing power right now will not give the same rewards as ensuring some of the 'unknowns' are fully researched and included as regards the accuracy of the models..
1) Extra notes.... Take today and this graphic taken from the above (to be saved)....

The whole of even the western hemisphere has been impacted by the the slope and shape of the high forecast to develop over the Bering Ocean. Changing its inclination or intensity will dramatically change the forecast for the whole Northern Hemisphere via mechanisms previously discussed on here. Both the ECM and GFS have shown this happening over the last week. Both had to withdraw from their positions . Something is not 'spot on'.
Will they this time? Can you tell me? I assume that this situations has come about as to their incorrectly handling the totality of the 'telecomms' signals.
2) As to whether the models are accurate from a scientific pov. I cannot make any comments (you are correct). However they have now released documentation on the 'CC' models, which were based upon forecast models (I am told), and for the previous release of them there were still around 25 assumptions which were not yet proven. If they were missing in the 'CC' models then I assume they were not in the forecast models. - In the CC models they substituted parameters.
Sorry to mention the XX word banned on here - MODS.
So IMO opinion, (FWIW) there is still quite a way to go before we can say that all the assumptions (and therefore the absolutely correct science) built into the models, means that models are correct.
Until that happens putting in more computing power will increase chaos (not decrease). that is what my 30 odd years of experience has taught me.
MIA
Original post: https://community.netweather.tv/topic/99760-model-output-discussion-colder-but-how-cold-and-for-how-long/?do=findComment&comment=5008583-
2
-
-
- Popular Post
- Popular Post
1 hour ago, Derecho said:Derecho...
30 years of modelling, programming , analysis, technology design and implementation has left its scars on me.
Twenty years ago we needed more machine power.
Now, unless we sort out the assumptions and get them analysed correctly into mathematics we will only magnify the errors as we push ever deeper into being able to look at ever more local detail.
Tamara is showing where some of the current assumptions are wrong, or at least give a totally different view. .
People on here showed how the stratosphere could affect things greatly. (10 years ago) This was incorporated into the models (though I believe is now possibly over responsive (see below)).
The only people to gain by increasing the computing power right now are 1) computer salesmen, and 2) system design specialists who have no further ideas as to how to improve the current models.
Incorrect assumptions ALWAYS increase volatility in output. Increased computing power will only serve to show up any design errors.
I appreciate that increasing the spread by the changing the input criteria, is one method of reducing any errors. But the initial 'errors' are still present, and will only serve to produce more chaos.
I am talking about from where the models are standing today (which is much better than they were 5-10 years ago). Spending hundreds of millions on more computing power right now will not give the same rewards as ensuring some of the 'unknowns' are fully researched and included as regards the accuracy of the models..
1) Extra notes.... Take today and this graphic taken from the above (to be saved)....
The whole of even the western hemisphere has been impacted by the the slope and shape of the high forecast to develop over the Bering Ocean. Changing its inclination or intensity will dramatically change the forecast for the whole Northern Hemisphere via mechanisms previously discussed on here. Both the ECM and GFS have shown this happening over the last week. Both had to withdraw from their positions . Something is not 'spot on'.
Will they this time? Can you tell me? I assume that this situations has come about as to their incorrectly handling the totality of the 'telecomms' signals.
2) As to whether the models are accurate from a scientific pov. I cannot make any comments (you are correct). However they have now released documentation on the 'CC' models, which were based upon forecast models (I am told), and for the previous release of them there were still around 25 assumptions which were not yet proven. If they were missing in the 'CC' models then I assume they were not in the forecast models. - In the CC models they substituted parameters.
Sorry to mention the XX word banned on here - MODS.
So IMO opinion, (FWIW) there is still quite a way to go before we can say that all the assumptions (and therefore the absolutely correct science) built into the models, means that models are correct.
Until that happens putting in more computing power will increase chaos (not decrease). that is what my 30 odd years of experience has taught me.
MIA
-
22
-
 31
31
-
- Popular Post
- Popular Post
1 hour ago, shawty1984 said:You can have all the modern technology you want, you are trying to predict the future, that's simply impossible on a scale you're asking for
I am afraid that we are now getting to the point that it is now the errors and assumptions in the software are causing the greater errors.
Until you get those sorted out you will just magnify the errors, and end up with even more chaos.
Spoken after 40 years in the software industry.
MIA
-
13
-
 1
1
-
1
-
- Popular Post
- Popular Post
1 hour ago, Met4Cast said:Well..
Bloody hell. This is probably the strongest wording I've seen you use in terms of cold & significant winter weather impact potential for NW Europe. In essence, teleconnections remain solid for -NAO and -AO throughout the rest of winter with likely repeated periods of high latitude blocking. The next MJO cycle progresses eastwards will see a return to strong +FT & +MT driving total AAM tendency upwards once again from an already high established Nino (+AAM) base state.
Myself and @Catacolhad noted that AAM tendency had bottomed out & returned to more neutral/positive values faster than anticipated, reading your post it seems you had expected a greater fall than observed too (GWO remaining above phase 4).
Thanks Tamara. As someone who is a lover of cold/snowy weather but also tries to remain balanced & unbiased in the context of the GSDM, for me, this is a very exciting update!!
Though of course, more regional (UK) based milage may vary, macro vs micro.
@Tamara (and Met4)..
Would you think that the Met office/ BBC should send out a red alert for the upcoming?
(Or possibly not in the BBC's case as would they even understand it?)
I must say I am learning more and more from you on these connections with the Tropics. It gives a longer term (1 week or more), that we can view the atmospheric characteristics, and have a good chance of being correct.
Like Met4 , and although I am no expert yet, I really find your analysis interesting.
Lets hope that you are correct. Despite my 80 years of age I am happy (for the first time really) that despite the advancements in computer technology we are making real progress in being able to forecast for everybody - even in today's chaotic worlds.
I have nothing against computers - I spent a whole career working with them - but unless you are absolutely spot on with your assumptions - they can be a long way out. Currently most of your assumptions are not handled by the large beasts at all, because there is no way that they can mathematically be programmed (just yet!). But I am sure it will come now.
With many thanks ..
MIA-
16
-
14 hours ago, ScottSnow said:
Certainly fascinating changes going on.
Regarding the volcanic eruption which has been rumoured on here to be the trigger for this increase in extent, do we know how long it’s impacts may last ?
Thanks for this Scott...
Below you will find some of my posts from just before Xmas on the latest at that point. The second is the more interesting.
All I can say is that the trend of increasing sea ice both in the Arctic and Antarctic has if anything INCREASED over the last couple of weeks - maybe just easing off very recently although I'll do today's update a little later on..
I put together several posts (early Oct - Nov timescale on here) with more details of what may happen, where it was suggested that 2 years would be about correct for any impacts. No one knows as it is the first volcanic eruption of this type we have witnessed in recent history (going back 200 years or more).
These impacts were expected to be positive for the first 12 - 18 months (approx 0.1C increase worldwide) and caused by H2O in the troposphere, but then as it was washed away and dissipated up into the strat it would be expected to reverse that trend, and it is currently being investigated by scientists worldwide, but is being ignored by the current news of the record warming in 2023...
I must admit that there is no other viable explanation for this sudden increase in worldwide ice... Certainly not repeated by the News channels.
I also am at a loss to explain why it is happening.
I have picked up my 2 recent posts as discussed above and shown below , but the posts has become too large to include the original posts (2 on Nov 22nd, and particularly the posts on Nov 24th) , so I invite everyone interested to go back and read into the Oct to Nov timescale (if still interested).
It certainly is a rare phenomena (-um ?) these days, and will give some people a real headache..
Current charts are still showing the same trends and are even more difficult to explain away.
MIA
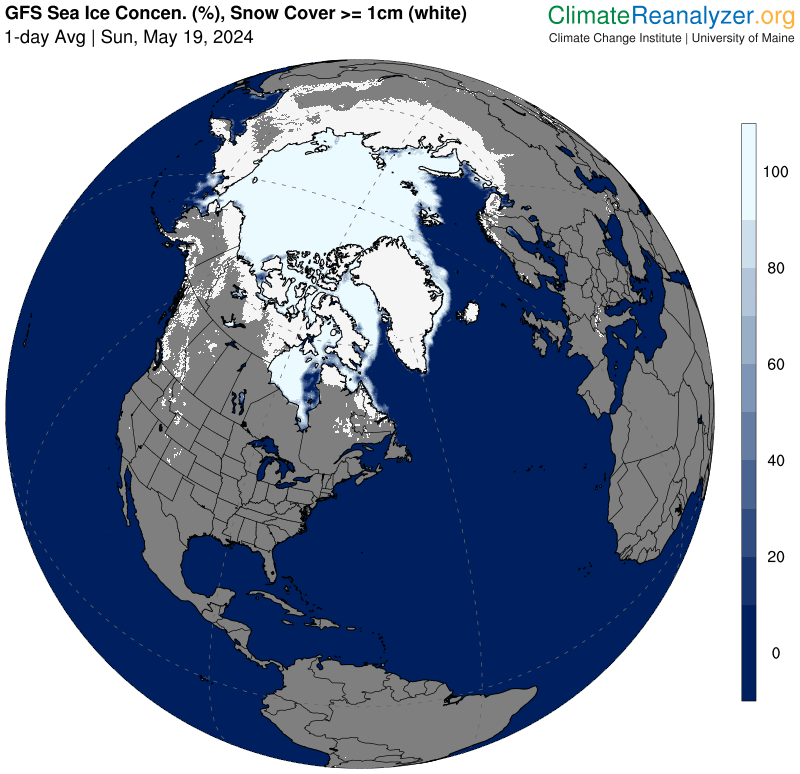
On 24/12/2023 at 11:58, Midlands Ice Age said:Thanks for the above Dave (Claret047), and may I wish a happy Xmas and a healthy and brilliant new year to you, and to one and all.
As it so happens I have been watching the worlds (not just NH) sea ice changes quite closely over the last 2 -3 weeks (over the long week end break)., and decided to do something about it as a report, which I will report separately below so as to not upset the normal flow on here.
So a quick update on the NH....
Snow has continued to be fairly sparse over the greater extent of the NH. The only places are China, Alaska and the Yucatan Peninsula, and Eastern Siberia to have excess snow at this date. However we live in hope!!.
Sea ice has continued to expand rapidly in the last 2 weeks. (thanks to the ASIF and Masie see below) -
ASIF (Jaxa) gone from 3rd (last week) to 13th lowest today, and looks a though it could easily go to 17th highest shortly (out of 17, although this include one year in the early 2000'nds ).
The change is as I believe, (as I suggested in my previous notes), to do with a quite quick refreeze in the Central Basin this year, followed by a consequent longer than normal lasting stasis, before the outer sea areas start to refreeze. This change now appears to be gaining momentum as ice completes (its admittedly late) arrival in Hudson Bay, but is steaming ahead in all the eastern oceans of Bering, the SOO , and now the Yellow Sea, (and also in Greenland).
However I have also noted widespread reports (particularly locally!!) of the very unusual appearance of many nacreous clouds in the northern hemisphere. Some lovely photos below from the MIdland thread (with thanks). They are not normally common unless the air is very dry and exceptionally cold and do indicate that much larger than normal levels of water vapor ( and other rarer gasses??) are present in larger amounts in the stratosphere.
The reason which appears to spring out to me is the effect of the Hunga Tonga Volcano water eruptions into the upper levels of our earth, maybe at a time of increased solar irradiation.
For a more detailed discussion of further interesting current observations see my next note below...
MIA
On 24/12/2023 at 13:10, Midlands Ice Age said:Following on from my immediate post above and this discussion we had in mid November on here (see above for the start), I thought that a worldwide sea ice extent discussion/report could be interesting (and unexpected for most).
(Thanks to the ASIF) I present the current worldwide charts and positions) -
A truly rapidly changing and unexpected set of charts.
Why might this be??
One reason is the rapid onset of the refreeze in the Northern Hemisphere as detailed in my previous post above, but it cannot explain everything. Examination of the SH has now suddenly also started to gain an anomalous and large amount of ice for the time of year.
So it looks as if we could well be seeing a sudden increase of ice extent across the globe.
When I wrote the November post (above), I commented that the Antarctic appeared to be in 'recovery' mode , well this has continued and if anything the trend has increased following the very low figures for 2022/23 S.H. Season. Extent has now reached 7th lowest (was 2nd 5 weeks ago, and lowest for most this year) .
I have looked down at the detail level for the Antarctic oceans and they show that the Weddell Sea has just about stopped melting, and most of the others are slowing down at the same time as the change to a slower rate of warming is occurring over the continent. The Weddell Sea is the largest ocean around Antarctica and it has suddenly appeared as the 20th lowest for area after being lowest for many months -
What is going on down there?
Well the only thing that can stand out is the Hunga Tonga Volcano. If you remember it was suggested that its effects might well take up to 2 years to work through the atmosphere. - , Well it looks like it took 18 - 20 months.
The fact that we are seeing huge (for us) amounts of nacreous cloud in the NH could well indicate that the H2O has now dispersed into the northern hemisphere as well, and that since the sea ice is recovering so quickly that its warming effects are now eroding away.
Can anything else be suggested?
It, to my way of thinking could not be CC direct impact as a large change (such as this in this direction) has not been postulated. It does however support aspects of the CC theory in that H2O in the stratosphere could be seen as vastly warming. although of a very temporary nature..
My thoughts are that it could also have long term implications for the development of life on earth. Maybe it was (going back 2 -3 billion years ago) a reason for the earth suddenly warming and cooling. During most of this time the globe was covered in oceans. The major continents (Pangea, etc) were fairly transient (as well as fairly small in total earth terms) and so any major long-term effects of tectonic volcanos (producing Co2 from underground seams of plants, etc ) (assuming there were any about then) would be vastly reduced at that time, in comparison to the huge amounts of time that earth was under oceans.
So , could my 'suggestions'/ideas be correct?
Only time can tell...
MIA
-
5
-
1
-
-
45 minutes ago, That ECM said:
Ridge gate done, bulge gate nearly done.
we now move on to northerly gate and low gate and then longevity gate.

Good post ECM ...
Was producing a post on the old thread but it got locked out. I am using your view of the NH to further my post of last night.
Since my post last night, the GFS has 'railed' in the Pacific high somewhat, but it has also aligned it more east west than it was yesterday.
This has allowed some of the cold Arctic air to slide further south (southern jet increased) over there, and not directly over the pole. This has enabled the jet to move a bit further south into the Atlantic and produced more 'randomness' in the Atlantic sector......
Meanwhile the ECM and MO have both picked up the signal for the Pacific high, but it is still a very weak affair and it is aligned similarly to the GFS.
This has then consequently caused the pull back somewhat (so far) of the high retrogression in the Atlantic.
There is a little further to go before we reach the middle ground position, for all the models I suspect. .
Also it does show that the Pacific high is unlikely to be a permanent feature as it wanes pretty quickly.
It, however, has not significantly affected the forecast temperatures over our side (more generally) - yet.
As usual, as I suggested last night could happen, we are ending up in a half way house 'blended' solution which is not without interest for going forward into February, as it enables the possibility of a permanent Scandy to develop over the snowfields there.......
It also shows that the signal yesterday on the GFS was real, though as usual, it overestimated the position and strength.
All very interesting from a learning of the models point of view. But what has cause the sudden appearance of the Pacific high?
MIA
-
8
-
1
-
-
7 minutes ago, MJB said:
Easterly en route ???
THis is my take, but it facts what we have seen develop so far...
I have used the above chart to demonstrate that the whole of the NH, not just our portion of it, is involved in the change, and not because it shows an easterly.
Just look AT IT.....
What stands out ?
It is the huge fully rounded high pressure over the Bering Ocean and the Aleutians. that one cannot avoid.
If it is not this shape but a wedge shape then it will not effect what happens, because it will block the low pressures and not force them over the top.
This high starts to form at exactly the same time (day 4 or 5) that the atmospheric pattern starts to deteriorate on our side of the globe.
I have explained the process before, the high pushes the cold Arctic into North America which destroys any chance that our retrogressing high has of reaching Greenland.
This is EXACTLY the same pattern that the ECM had last week for 36 hrs, before it too decided it would not be a driver and reverted back to the other models situation
I suggest that exactly the same situation will happen with the GFS, as the models are known to flounder when a strat event approaches.. (however one day it will occur, but I suspect that most models will see it happening at the same time).
Has it called it correctly? . I expect that we will find out by Wednesday evening, when it will slowly start to drop the pattern, exactly as the ECM did.
If you want some good news then it is that most routes seem to return us (the Atlantic) to a cold scenario, but necessarily blocked, which should enhance the chances of snow.
The big (IMO) question is what has led it along this pathway, and is up the wrong path?
MIA
Original post: https://community.netweather.tv/topic/99706-model-output-discussion-into-2024/?do=findComment&comment=5004313-
1
-
-
- Popular Post
- Popular Post
37 minutes ago, MJB said:
Easterly en route ???
THis is my take, but it fits the facts that we have seen develop so far...
I have used the above chart to demonstrate that the whole of the NH, not just our portion of it, is involved in the change, and not because it shows an easterly.
Just look AT IT.....
What stands out ?
It is the huge fully rounded high pressure over the Bering Ocean and the Aleutians. that one cannot avoid.
If it is not this shape but a wedge shape then it will not effect what happens, because it will block the low pressures and not force them over the top.
This high starts to form at exactly the same time (day 4 or 5) that the atmospheric pattern starts to deteriorate on our side of the globe.
I have explained the process before, the high pushes the cold Arctic into North America which destroys any chance that our retrogressing high has of reaching Greenland.
This is EXACTLY the same pattern that the ECM had last week for 36 hrs, before it too decided it would not be a driver and reverted back to the other models situation
I suggest that exactly the same situation will happen with the GFS, as the models are known to flounder when a strat event approaches.. (however one day it will occur, but I suspect that most models will see it happening at the same time).
Has it called it correctly? . I expect that we will find out by Wednesday evening, when it will slowly start to drop the pattern, exactly as the ECM did.
If you want some good news then it is that most routes seem to return us (the Atlantic) to a cold scenario, but necessarily blocked, which should enhance the chances of snow.
The big (IMO) question is what has led it along this pathway, and is up the wrong path?
MIA
-
10
-
2
-
4
-
- Popular Post
***** SEA ICE IN THE NORTH SEA ******
Thought it worth a post to back up what Aleman and I were discussing above.
Believe it or not it looks as if it has just happened in the North Sea, !!!!!!!!!!
Was looking at the spread of the sea ice in the Baltic (graph below) whilst I checked the Masie Sea ice map for the Baltic (screenshot below)
If you zoom in on the screenshot you can see a lot of 'sea ice' off the west coast of Denmark. (Part of the North Sea)
Now I know it has been cold over there but not yet cold enough for sea ice to widely form.
They have had a lot of snow however.... I think it must be this which has laid down a layer of slush on the sea surface and which has now frozen over.
Also apparent should be a small patch of, I think, natural sea ice off the east coast of Southern Norway,, at the end of the newly laid down sea ice along the Baltic coasts of South Sweden.
These situations I have not witnessed before this century. 2010 was the last major freeze in the Baltic. I do not recall this happened even then.
Happy times...
MIA
-
6
-
1
-
5
-
9 minutes ago, NewEra21 said:
I disagree here New..
As per my post above ECMWF had exactly the same wobble last weekend (and days earlier)
The real interest is what is causing the 2 models to behave in this way.
MIA
-
6
-
1
-
1
-
-
15 minutes ago, IDO said:
The Pacific Heights are changing the pattern from D8, with the axis of cold moving from N-S to E-W over the pole, so guess who is in for a cold spell on the 06z, D8-12:
That is clearly something that could easily change.
IDO..
I think you have hit the nail on the head with that jpg.
Going back to the weekend when the ECMWF was having a wobble I produced post which showed that it was the Pacific grossly inflated and rounded high that had thrown a spanner in its works. It caused all the Vortex to move back from Siberia to Greenland for a few runs. I put it down to strat warming.
The GFS now seems to have come across the same requirement - with exactly the same results.
The question is - what is causing the models to think that the Aleutian high is going to happen?
Everything seems to follow on from that movement.. To fit it in, everything else moves around.
It would appear that it does not know how to fit it in as it 'jumbles' from run to run.
The net result appears to be chaos. Could it be that it too is picking up on the current strat warming? and that is what is causing the model chaos.
I am convinced that this is what is throwing the model.
MIA
MIA.
-
4
-
1
-
-
4 minutes ago, sheikhy said:
Gfs doesnt have a scooby of whats goin on!!look at the difference between the 0z run and 06z run at 204 hours
 !!!
!!!
The GFS looks to me like a game of chess..
It seems to knows where it wants to get to .....(governed by the MJO?) (I also know that this is not how the models work!!) , and it cannot get there without rearranging all the major pieces.
Something doesn't look quite right in the way that it moves the prize pieces around the board.
MIA
-
6
-
-
No one up yet this morning?
A beautiful day at the moment, but with the temp still below freezing -0.5C and a stiff wind it feels like the Baltic has arrived.
Oh wait a minute it has!
My pond has surface level ice this morning. Wasn't expecting that just yet.
Looks like a coldish frosty, DRY, week , before the colder air reaches us at the weekend.
After that...
Could be a major blizzard, could be rain, could be a snow to rain to snow...... its up in the air.
This winter is more like the good old fashioned 60 - 80's I remember of old!
Long may it continue for you guys. These totally Atlantic driven days are really so boring.
MIA
-
1
-
-
14 hours ago, Aleman said:
I've seen Icelandic sea ice a few times in recent years (to the West/NW). Maybe there is a small shallow there and/or heavy snow has dropped on colder water on that side. It's an unusual connection to Greenland I'm wondering about.
With regard to sea ice forming, sea new ice off Newfoundland after recent snow. There is occasionally isolated ice patches recorded in this cold sea area after heavy snow. I think I posted similar last year.
Thanks Aleman..
I hadn't forgotten your views, and I do agree with them, but I believe in the Jan Mayen Islands they are talking about the main pack, showing its hand.
I am suggesting that that there is a chance it may visit Iceland this year (though still unlikely)
MIA
-
4 minutes ago, Nick F said:
Morning. Now the models seem to be settling on the cold northerly next week, thought I might start to posting some thoughts.
00z GFS looks a bit too bullish with the Atlantic encroachment from the SW next week, also it blows up a low south of Iceland early next week which phases with the Atlantic low system to the south - which the other models don't have.
Be interesting how well the models handle how far the south the deep cold gets and how far north milder air gets - the boundary bringing a high risk high / reward of heavy snow or rain wherever it sets up.
Lots for the models to resolve next week, but think the 00z GFS looks a little too bullish with the Atlantic push, has a habit of blowing up lows too much.
Good balanced post Nick..
We all know that the GFS tends to blow up the lows a bit towards FI. I expect we will end up in a half way house situation, which means nothing will get resolved until the last day.
Back to the 60-80;s again.
MIA
-
8
-
-
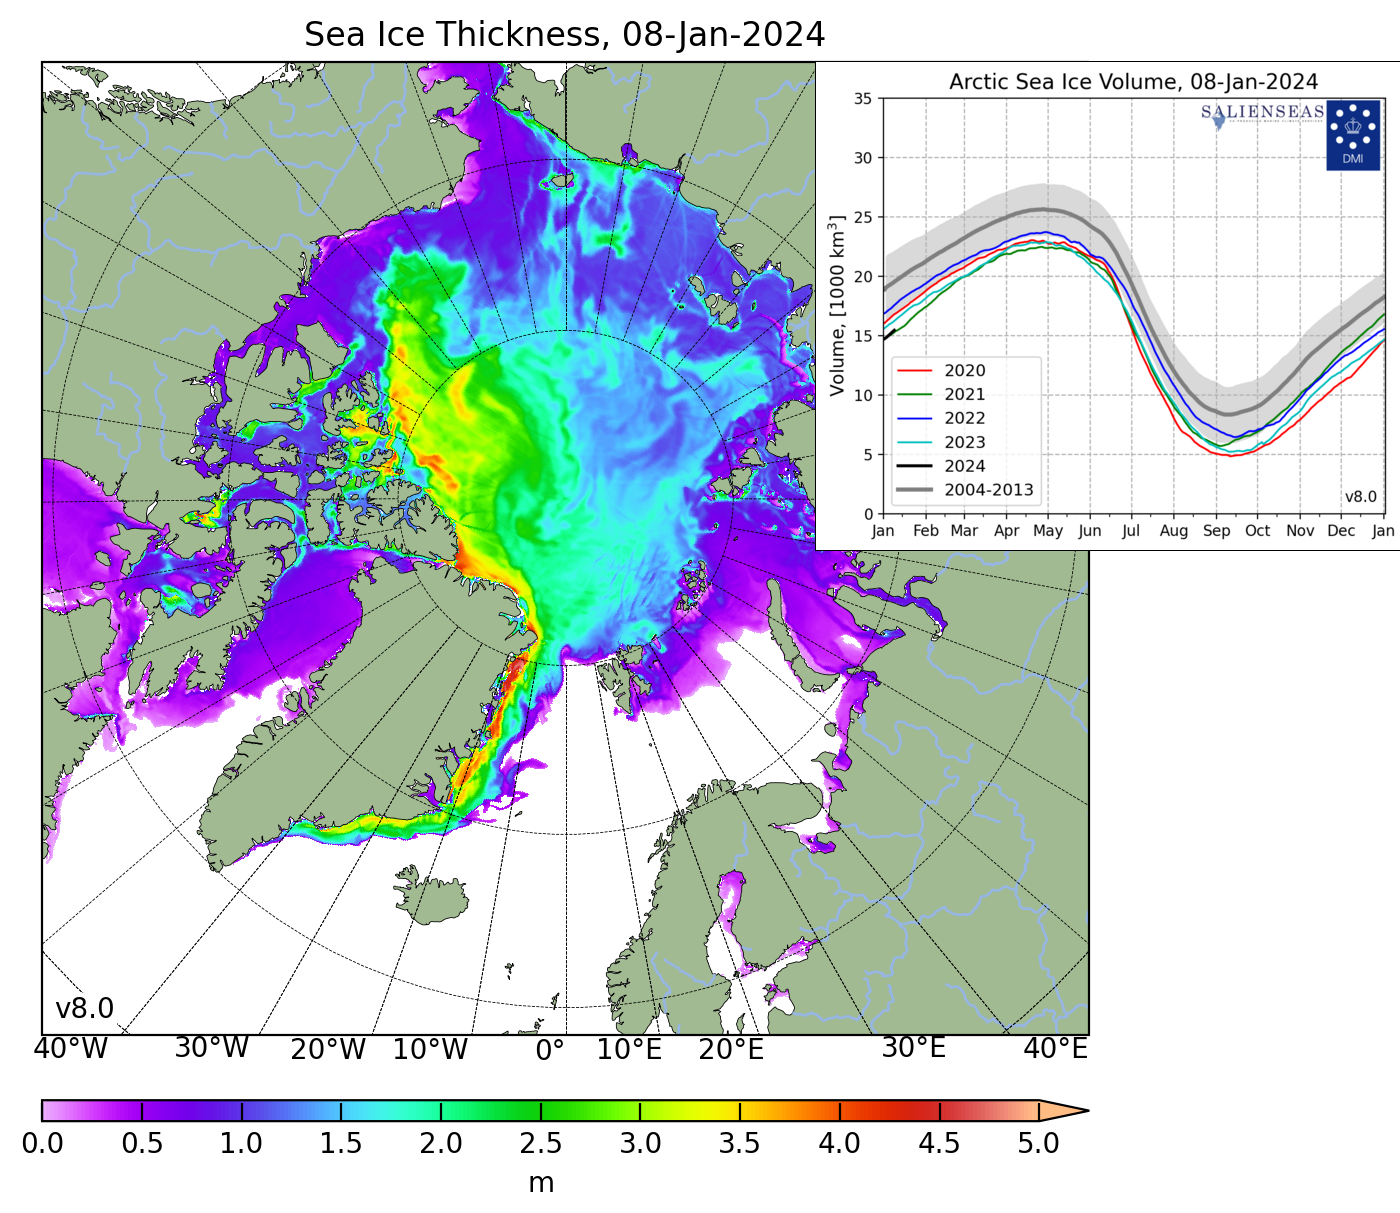
Following a post that I made in the MAD thread I realised that I had not performed an end of month review of the Arctic volume and thickness .
So here I go to correct the situation.
Despite the rapid increase in surface ice (extent) , the volume and thickness graphs have not followed suite.
This is not surprising as 95% of the NH ice is stored within the Arctic basin and we know that the large amounts of sea ice increases are new shallow ice, and have been recorded outside the basin.
However, it is worth exploring in a bit more detail and here is my normal chart for thickness and volume from the DMI -
and for end of year
So these are not showing much in the way of change .
However, below the totals are some large regional changes which can be seen in the graphicals below, (thanks to the ASIF) -
for totals
and the following for all others within the 'western' basin -
and the following for eastern oceans =
These show (as we have experienced elsewhere) that the Russian oceans are rapidly gaining ice , whereas the western US oceans seem to be below average, and hence are losing ice..
This seems to be the major difference that the ice is showing this year.
More ice than recently in the East, less than the last few years in the West.
It applies to all measurements of ice.
The real question is why has this happened. It also seems to be leading to more surface ice but will it affect longer term ice figures?
MIA
-
8
-
-
3 hours ago, johncam said:
See the ice has also reached Jan Mayen Island according to latest Masie which must be the first time in a lot of years
Interesting this John.
Ice has only appeared once or twice round the island this century. It happened reasonably regularly last century.
It is SW of Svalbard and about 200 miles from the Greenland land mass. Its the little red dot.
It is the dot here of Greenland, with ice close by (as you suggest).
The famous Peter Wadhams has been keeping data from the island, and has identified 2 conditions for the ice to appear here.
1) During a cold winter - when there is a large flow through Fram (this year?) . It is the most common form/condition by a long way.
2) Late in the freeze season when a strong Arctic anticyclone has formed, and ice gets transferred from the Greenland ice pack to the SE.,
This year it could happen by combining both causes!!
It also happens that it seems to be a regular precursor to Icelandic sea ice.
The following is a video of the ices approach in detail -
https://seaice.de/AMSR2_Central_Arctic_SIC-LEADS.gif
MIA
-
4
-
-
5 minutes ago, Drifter said:
Is everyone holding their breaths!
Can I breathe out yet?
Only I don't feel too good now.
MIA
-
5
-
1
-
-
Had a few snow grains land on the windscreen of the car parked in Acocks Green about 45 mins ago.
Wouldn't have seen it if I hadn't been in the car. So has also reached Brum.
Good news is that even this light it is at least snow,
MIA

-
2
-
2
-
-
3 hours ago, Met4Cast said:
Some won’t be happy until we see a return to snowball earth and even then I’m sure they’d find a reason to complain.
Great modelling across the board this morning, the GEFS extend the cold (using -5C isotherm as the guide) another day or two with a tighter clustering of cold members.
Details chop and change but the broad direction of travel remains the same. The GEM & UKMO are pick of the bunch for me.
I think that I might qualify in that category
3 hours ago, Harveyslugger said:People expecting an ice age

Well just look at my name....
 Of course I am. Maybe not reaching the south coast... but the M4 will be OK.
Seriously though?...... I am waking from my 50 years of snoozing... My alarm clock went off early this morning when the sea ice extent figures from JAXA appeared and we have the highest amount of sea ice for the last 21 years. It is now greater than it was in the 2000's.
There is enough cold air in the Arctic at the moment for everyone to share.
PS... I have no idea why....... especially when apparently worldwide temps are so high. Even the Antarctic extent has rapidly caught up with its averages!!.
MIdlands Ice Age
Original post: https://community.netweather.tv/topic/99706-model-output-discussion-into-2024/?do=findComment&comment=5000985-
1
-
1
-
-
3 hours ago, BarometerCat said:
and later..
Swiss HD 4x4 recommended yesterday also shows light snow but as always lots of other factors and most will expect nothing at all
This would tie in with the longer trek across the North Sea for here compared to the SE.
The convergence zone off Denmark is also very hopeful and reassuring that we may pick up a good streamer later on.
Against that we have the higher heights reducing the amount of water vapor. Are the '850's stil expected to drop to -10C?
MIA
-
1
-
-
- Popular Post
- Popular Post
3 hours ago, Met4Cast said:Some won’t be happy until we see a return to snowball earth and even then I’m sure they’d find a reason to complain.
Great modelling across the board this morning, the GEFS extend the cold (using -5C isotherm as the guide) another day or two with a tighter clustering of cold members.
Details chop and change but the broad direction of travel remains the same. The GEM & UKMO are pick of the bunch for me.
I think that I might qualify in that category
3 hours ago, Harveyslugger said:People expecting an ice age
Well just look at my name....
Of course I am. Maybe not reaching the south coast... but the M4 will be OK.
Seriously though?...... I am waking from my 50 years of snoozing... My alarm clock went off early this morning when the sea ice extent figures from JAXA appeared and we have the highest amount of sea ice for the last 21 years. It is now greater than it was in the 2000's.
There is enough cold air in the Arctic at the moment for everyone to share.
PS... I have no idea why....... especially when apparently worldwide temps are so high. Even the Antarctic extent has rapidly caught up with its averages!!.
MIdlands Ice Age
-
40
-
4


 and for end of year


Midlands regional discussion - Winter 23/24
in Midlands Weather Discussion
Posted
Not too active on here as its very dull and quite cool around here today!!
Oh yes, I am sure that the forecast of us missing any snow has helped as well
However I am still not convinced that we will miss out as the less cold weather moves in next week.
Keep your pecker up!
MIA