


Vorticity0123
-
Posts
414 -
Joined
-
Last visited
-
Days Won
6
Content Type
Forums
Blogs
Gallery
Events
Learn About Weather and Meteorology
Community guides
Posts posted by Vorticity0123
-
-
- Popular Post
It appears that parts of Western Europe are heading for a significant cold snap. Details still have to become clear, though. Yet, there is another remarkable player in the field which could have significant implications on our weather. And yes - this may well be a subtropical storm in January!
A subtropical storm in January?
The system I mention is located in the southwestern corner of the map below.

ECMWF 500 hPa heights (colours) and surface pressure (white lines) 12Z T+24.
As you can see, the system (designated 90L), has a core pressure of just below 1000 hPa. At first glance this system does not look like a remarkable system. And yet, this system may become a very special one. It appears that 90L may turn into a subtropical storm, if it does so it would be named Alex. The NHC currently assesses the chances at about 50% that this system will become a subtropical cyclone. That would result in a very early start of the 2016 Atlantic hurricane season.
From NHC:
Quote1. Cloudiness and thunderstorms have become a little more concentrated and organized near the center of a non-tropical low pressure system centered about 1100 miles southwest of the Azores. The low is producing winds to near 60 mph over the southern and eastern portions of its circulation. Although environmental conditions are only marginally conducive for development, this system could become a subtropical or tropical storm within the next day or so. The cyclone is expected to move eastward to northeastward over the eastern subtropical Atlantic over the next couple of days. Regardless of subtropical or tropical cyclone formation, this system is expected to produce hazardous marine conditions over portions of the eastern Atlantic for the next few days. For additional information, see High Seas Forecasts issued by the National Weather Service and Meteo France. The next Special Tropical Weather Outlook on this system will be issued by 2 PM EST Wednesday. * Formation chance through 48 hours...medium...50 percent * Formation chance through 5 days...medium...50 percent
Towards the North Atlantic
One thing is certain - and that is that if Alex would develop, its lifetime will be relatively short. The models are insisting on moving 90L towards the north. The ECMWF shows this nicely:
ECMWF 500 hPa heights (colours) and surface pressure (white lines) 12Z T+24.
The system is denoted by the black circle. Along with its northward movement, the low pressure area is also taking a large swath of warm air along with it northward.
ECMWF 850 hPa temperature (white lines) 12Z T+24.
The red arrow indicates the movement of relatively warm air at 1500 m (about equal to the 850 hPa height) towards the north. The main question is of course: why would this be so important for our weather in the long term?
Boost to uncertainty?
Often, (sub-)tropical storms entering the extratropics tend to increase uncertainty in forecast in the extratropics. Such systems could (via interaction with other systems) cause wild swings in model output over extended timeframes.
Here, it seems that the system gets caught into a low pressure to the south of Greenland. Ahead of this system, warm air advection (seen by the yellow colours in the surface pressure and 500 hPa chart) is taking place. This could in this particular situation result in a formation of a ridge (a 500 hPa high pressure area) and associated surface high pressure area.
The bottom line is that as long as the fate of the system near the Azores remains uncertain, the system itself could aid in causing wild swings in the forecasts to follow. In which way these model swings will go remains to be seen. Nevertheless, this system could be an interesting player in the model forecasts to follow in the next few days.
EDIT: just as a point of interest: the 'undercut' of the low pressure area towards France under the high pressure area situated near Iceland (both at 500 hPa and at the surface) could well be linked to the ultimate fate of the low pressure area that I mention in the post above. Though the link is not a 1:1 relationship, it will definitely be linked in some kind or way.
-
 48
48
-
Here is another series of links which may be of some help regarding terminology :
http://www.theweatherprediction.com/blocking/
http://www.theweatherprediction.com/habyhints2/457/
Much more info can be found there, probably that helps out some?
-
2
-
-
1 hour ago, wanzelbin said:
I posted this on the Model Discussion thread a few days ago, but I didn't get a reply - guess I should have put it on here.
Hope someone might be able to straighten out some of my ideas below.
Many thanks
Understandably the terminology that is given on the forum could indeed be very confusing - I sometimes am also confused by some terminology even though I have been around in the weather for quite some time now!
Often some terms are used interchangeably (for example ridge and high pressure area). The meaning of some of these words is also not very clear. For example, a 500 hPa ridge is high pressure at the 500 hPa height surface. And a ridge at the surface is just a high pressure area at the surface. More often than not (me included) the exact meaning is not given, but can be deduced on the post itself based on experience.
For your question regarding DAM-values, I would suggest reading this guide from John Holmes:
And for the GFS chart:
EDIT: I see the links above contain documents which contain a broken link. The links (when they were available) contained very useful and easy-to-understand guides.
I'll try to go into somewhat more detail regarding these terms later today or tomorrow if needed. Maybe John Holmes would be able to supply the documents in the links above?
-
2
-
-
Not exactly the image one would expect in January! The 2015 Central Pacific hurricane season is just continuing on its same pace in 2016. El Nino has likely been a big player in this development with much higher than average SSTS (sea surface temperatures) at that location.
Satellite image of the Eastern- and Central Pacific. Source: NOAA.
This system reminds me a little on Hurricane Ekeka in 1993, which also developed in January in an El Nino year in the Central Pacific. https://en.wikipedia.org/wiki/Hurricane_Ekeka
-
1
-
-
- Popular Post
After a record-crushing warm December month, January has so far delivered much more seasonable temperatures. In the Netherlands, some parts in the northeast have experienced a rather weird winter. Days of freezing rain made it possible to go ice skating on roads. Read more about it in my previous post here. Nevertheless, the southwest of the Netherlands, and most parts of the UK as well, have seen very little in the way of winter. Yet, changes may well be on their way, as possibly northerlies are going to set up shop. How does this look like, and what about possible uncertainty? Time to read on!
Here I mention the 500 hPa level. I assume this level is located about in the middle of the troposphere. I use this level here because the 500 hPa level is less influenced by surface features (like friction) than the surface level.
Troughing into Europe - High pressure towards the Atlantic?
Let's start with the current weather pattern.
GFS 500 hPa heights (colours) and surface pressure (white contours) as of today 12Z.
The chart shows little in the way of winter for the UK as of yet. Low pressure (and 500 hPa troughing, blue) in the Atlantic to the west of the UK is causing mostly unsettled weather there. Behind this low pressure area, we can see a ridge (yellow colours edging northward) buidling near Newfoundland. The ridge is forecast to move into the Atlantic, whereas the low pressure activity is expected to move into Europe towards Scandinavia.
If the ridge near Newfoundland would be able to amplify enough (that means that it is able to extend far enough northward), it may allow for cold air to flow from the north to the UK. Will this happen? That appears to be the main question for now. It should be stressed that the situation as described above is a severe simplification from reality, as many other minor developments are bound to change the details. For simplicity and clarity reasons, I will only focus on the large scale developments, and NOT on the small-scale features.
What about the differences and uncertainty?
Here we make a jump of 6 days. In order not to get a too messed pattern, I use an ensemble map instead of the operational run. Since the GFS run did not work on my computer, below are the ECMWF ensembles.
GFS 500 hPa heights (colours) and surface pressure (white contours) as of today 12Z.
At the large scale, we see a 500 hPa trough over Scandinavia, whereas some ridging at 500 hPa is evident over the Central Atlantic. The ridge is extending northwards all the way towards Greenland (yellow and green colours extending northward, red arrow). All models roughly agree on this pattern, but once again the devil is in the detail. Though we can also extract some more large-scale differences as well. Below are the ECMWF, UKMO and GFS operational runs for the very same timeframe as given above (for 6 days out):
One clear difference in the models is the degree of amplification (northward extension) of the ridge over the Mid-Atlantic. The ECMWF and UKMO tend to amplify the ridge more than the GFS. The result of more northward-extension would be a higher likelihood of a more northerly base flow instead of northwest or west, with more chances on wintry weather.
Furthermore, we also see a myraid of solutions concerning the shape of the trough (blue colours) over Scandinavia. Nevertheless, the presence of this feature is quite certain. It is yet too early to talk about surface features, though, so to what extent a cold spell will develop or not over the UK is still in debate. A good guide for that are the ensemble forecasts as posted by Captain Shortwave.
Mid-Atlantic or Greenland ridging persisting?
In the long term, it seems that we will see a continuation of ridging over the Mid-Atlantic towards Greenland and beyond.
NOAA 500 hPa heights (green) and anomalies (red and blue) for 6 to 10 days out.
The map above shows a 'kink' in the green lines towards the north in the center of the Atlantic (also indicated by the red arrow). This 'kink' is indicative of the presence of ridging (high pressure activity). With this kind of ridging present, one could suggest that a northerly component is likely in the flow over the UK (see black arrow over the UK which runs parallel to the isobars). Therefore, I expect the temperatures during that period to be below average. This statement is in agreement with the ensemble forecast shown by Captain Shortwave. To what degree these below average temperatures will end up remains to be seen, but a somewhat more cool (fore some parts even wintry) spell appears to be quite likely in the medium-to long term.
I hope this post gives an understandable overview of the weather to expect in the coming days and also the uncertainties still present at large scales. If anything is unclear with respect to this post, just ask!
Sources:
http://www.wetterzentrale.de/topkarten/fsecmeur.html
http://www.cpc.ncep.noaa.gov/products/predictions/610day/500mb.php
-
34
-
17 minutes ago, frozencanals said:
Just heard from my friends in Holland that in the north of the country they are ice skating on the roads as everything has suddenly frozen over, the cold is creeping closer, will it ever get here?
Well... not what you see on a regular day! Ice skating on the roads is indeed very well possible!
Ice skating on roads in the Netherlands. Source: RTV Noord.
See for even more ice fun the link here. These are images that will be remembered for a long, long time.
And for some more information about the meteorological background see https://forum.netweather.tv/topic/84756-model-output-discussions-pm-311215/?page=38.
-
2
-
-
- Popular Post
- Popular Post
While the UK is seeing very little in the way of winter, on the other side of the pond the winter is very close – unexpectedly close! In a very small country like the Netherlands, this small ‘winter outbreak’ is creating a huge divide in temperature. In a distance of merely 300 kilometres, temperatures differ by an impressive 13*C! Also, people have been able to skate on roads due to glazed frost outbreaks. That truly is winter, though a very dangerous one!
Just as impressive is that electricity has been going on and off at many places in the north due to frozen rain getting stuck on power lines. That must be quite eerie to witness. Also, some schools are being closed due to risks on glazed frost. Time to explore this unusual wintry setup!
Winter has reached the Netherlands.
From winter to spring temperatures – just in one country! Courtesy to weerwoord
A winter outbreak has rarely caused such large temperature differences over such a small distance in the Netherlands. Whereas temperatures are a mild 9*C in the southwest, in the northeast freezing temperatures are observed down to about -4.6*C, almost moderate frost!
Current temperatures in the Netherlands. Courtesy to Weerplaza.
Separated by a very narrow line
The vast difference in temperature is represented by a very small line (a surface trough), where the wind jumps from south to east.
HIRLAM (HIRES model of the KNMI) wind forecast for today 21Z. Courtesy: Weeronline.
Above the black line, winds are blowing from the east. These winds are transporting very cold continental air bringing winter weather. On the other hand, to the south of this line southerly winds are advecting mild air into the Netherlands as well. And this interplay is creating a fierce battle – a very dangerous one as well.
Warm air above cold air – extremely slippery and glazed frost!
The fierce battle is played mainly to the north of the aforementioned surface trough. The warm air brought in from the south is unable to ‘remove’ the surface cold layer to its north. Therefore, the only way it can go is up. In this way the warm air slides over the cold air. The result is a dreaded ‘ice triangle’ as it is called in Dutch.
GFS sounding for the northeast of the Netherlands for 21Z. Courtesy: MeteocielThe black line indicates the zero degrees line. Note that whereas at the surface temperatures are below zero, between 300 and 1000 meters the temperature is significantly above zero. This is definitely not the most usual configuration you see in the atmosphere.
What happens is that snow melts in the aforementioned melting layer into rain. Just before reaching the surface, the rain freezes again, creating an ice floor on the roads, and thereby very dangerous and slippery conditions. Somewhat further to the northeast, this warm layer is not present, so there precipitation falls just as snow.
Warnings for very dangerous conditions
It is expected that about one centimetre of glazed frost will fall in the northeastern parts of the Netherlands over the next day or so. Such situation could cause life-threatening situations, and therefore the KNMI (Dutch version of the MetO) has issued warnings for these provinces.
More glazed frost to come?
It seems that even more parts of the Netherlands are becoming prone to glazed frost in the short run. On Wednesday, the frost near the surface is expected to expand all the way to the centre of the Netherlands. Along with some precipitation forecast, glazed frost is quite likely. I have seldom seen so many days with glazed frost in the Netherlands in a row.
Also very impressive is to see such large differences in an ensemble forecast over such a small distance. To show this, below are the ensembles for the southeast and the center of the Netherlands.
ECMWF ensembles for the middle (left) and southeastern parts (right) of the Netherlands. Courtesy: Weerplaza.
Note how the spread for Wednesday for the middle of the Netherlands is about 7*C, only for 2 days out. But also the spatial differences are remarkable. In the southeast no member is showing any winter on Wednesday. And yet, almost all ensemble members in the center of the Netherlands do show winter weather for Wednesday. And that two locations located only about 150 km from each other!
Winter weather in the end?
To end with a long-term wintry outlook, what all ensembles do show as well is that temperatures will steadily drop in the long range after a mid-term peak. The majority of the members is indicating some kind of wintry weather as well, with night frosts and daily temperatures a few degrees above zero.
Concluding note
Much more can be said about the glazed frost, but I hope this gives a nice overview of this impressive event occurring in the Netherlands. This definitely was not envisaged by the models over the past few days, though the cold was always worryingly close. This all is nice evidence that you really need models with high spatial resolution to capture the temperature pattern over the Netherlands properly, and to make a good forecast. All in all, a very interesting meterological situation is unfolding!
-
62
-
I made a post about the long range teleconnective field (like ENSO, MJO etc), and connected them to look at any predictive value these may have. In fact, the signals together do point towards a risk on northerlies. You can read it all in the link below!
https://forum.netweather.tv/topic/82525-long-range-forecasting-and-teleconnections/
-
2
-
-
Winter is now well underway, though it is all feeling more like mid-Autumn. The UK has been soaked over and over again, sometimes by bands of moisture-loaded conveyor belts originating all the way from the tropics. For much of Europe, December has also been a record-shattering month. In the Netherlands, the average temperature record high was literally crushed by an astounding 2.3*C!
After this extremely warm and for the UK very wet December, hopes are up that probably the rest of the winter may deliver some wintry weather, or at least some dry spells. Will this finally be bound to come? In this post we’ll go through a journey of teleconnections in search for signals for the weather to come in the near and far future. Off we go!
Blocked and stretched
Before diving into the teleconnections, we will first examine the broad picture on the Northern Half.
GFS analysis of 500 hPa heights (colours) and surface pressure (contours) as of 12Z 03-01
Here it is important to note that the main focus will lie at the 500 hPa heights, as these are less sensitive to surface disturbances and friction. The pattern is looking far from circular to say the least. Two strong blocking highs (indicated by the black arrows) are well visible on the scene. One is located over the western US, while the other one (also the stronger one) exists over central Siberia.
In between these ridges of high pressure, an elongated area of troughing is extending all the way from Japan down to Canada (black line and blue/purple colours). This troughing is ‘squeezed’ by these two ridges of high pressure. With some imagination one might call the area of troughing indicated by the black line as being the tropospheric polar vortex (or vortices).
The same pattern up high?
The pattern described above is also nicely represented in the lower stratosphere:
ECMWF analysis of 100 hPa heights as of 12Z 03-01
Note that the orientation of the map is slightly different from the one before! Here we also see a highly elongated polar vortex stretched from Japan to Canada (indicated by the black line). The similarity to the 500 hPa pattern is quite striking. This is also the reason why I am mentioning the term ‘tropospheric polar vortex’ above, since the locations in the mid-troposphere and the lower stratosphere nearly overlap.
With a little bit of fantasy, the same ridges of high pressure can be found in the lower stratosphere as well (compared to the 500 hPa level, referred as the mid-troposphere). However, these ridges are notably less pronounced aloft.
Still cold in the Atlantic ocean – even record cold?
Time to go into the ‘deep’. As noted in the thread about the Atlantic Ocean, the ocean has been notably colder than average during the past year or so. In fact, according to Phil Klotzbach, northern parts of the North Atlantic have seen the coldest SSTS (sea surface temperatures) on record! That is quite impressive for a warming Earth to say the least.
Sea surface temperature anomalies over the past year over the Atlantic. Courtesy to Phil Klotzbach.
Unfortunately, coupling these anomalies to air pressure anomalies is hard to say the least. This has to do with the wealth of factors that affect the weather aside from the SSTS.
Very strong anomalies aloft coupled to the ocean
Still, let’s boldly see whether there is any kind of linkage. And I can say, there is quite a strong one!
500 hPa height anomalies over the past year over the Atlantic.
Negative heights (so anomalous low pressure) has dominated during 2015 near Greenland and Iceland, while positive heights (anomalous high pressure) prevailed over the Atlantic subtropics. This is typical of a positive NAO pattern.
Is it possible to couple the record low sea surface temperatures in the North Atlantic to these strong height anomalies? Probably, but for me it would go too far to put a one to one relationship here.
Still, an explanation that is possible is that the record cold North Atlantic SSTS, coupled with the slightly warmer waters in the subtropical Atlantic, strengthened the temperature gradient between these areas in the atmosphere. This could have resulted in stronger and more frequent low pressure activity over the North Atlantic.
Currently, the same SST anomaly pattern is still there. Often SSTS do not change rapidly over time, so it is a reasonably safe assumption to say that this situation will remain the same for the coming winter.
El Nino has dominated – and will continue to dominate
About ENSO we can be very brief. A strong El Nino has developed, and this El Nino appears to continue for the rest of the winter at least.
Sea surface temperature anomalies over the last week over the Eastern Pacific.
Though El Nino does not have many direct effects to our weather, it does have predictive value when looking at other subseasonal teleconnections like the MJO. So let’s take a look at these!
MJO on the run, but does it have any predictive value?
The MJO is currently rather active and located in Phase 6 or 7. The future of the MJO seems to be very uncertain yet, with the GFS and ECMWF being at two different paths so to speak.
ECMWF (left) and GFS (right) MJO forecasts per 1 January.
So, where does this bring us? According to the GFS, the MJO will remain very active and progress from phase 7 to 8. The ECMWF is much more ‘progressive’, and takes the MJO through phase 8 and 1. It also weakens the MJO significantly.
Based on the ENSO, it is possible to make composites for each phase of the MJO based on past events. In this way it enables one to forecast future pressure patterns based on past and future MJO data. This could be quite a convenient way of forecasting.
It is important to remember that these composites do not act as a literal comparison, they cannot be taken at face value. Rather, they should be used as an indication. In the links below the 500 hPa anomaly composites for each relevant phase are given for January with an El Nino active.
Phase 7 (check with the current situation!)
The 500 hPa anomaly pattern of the current location of the MJO (phase 7) does by no means reflect the current pattern observed at 500 hPa (see the first image of this post as a reference). The only thing I can see which matches the current situation is the high pressure activity over Siberia. Phase 8 and 1 would indicate high pressure activity over Europe or later on, Scotland, but for now these signals are not being modelled.
GWO spiking upwards
One of the strongest signals so far is the Global Wind Oscillation. It has been showing very high angular momentum amounts during the past few weeks or so.
GFS MJO forecast per 3 January.
The GWO trend is even ‘off the charts’ (rightward) today in Phase 5. Later on, the GWO is trending towards Phase 6 and 7, and probably 8 in the end. Apparently, the AAM (atmospheric angular momentum) budget is expected to remain very high over the next few days or so.
Admittedly, I am not yet skilful enough to interpret these GWO plots and translate them into something of value to the weather over Europe. For this I would refer to Glacier Point or Tamara, who are much more knowledgeable on this subject than I am
Upper stratospheric polar vortex remaining steady?
For now, it appears that the polar vortex in the upper stratosphere is not going to give way very quickly. Therefore, it does not seem to have much influence on the weather to expect in the near- and medium term. Read more here: https://forum.netweather.tv/topic/84231-stratosphere-temperature-watch-20152016/?page=21.
Blocking over the North Pole far ahead – reflecting the MJO?
In the long term, some interesting developments appear to be going to unfold.
NOAA 8-14 day 500 hPa heights (green) and anomalies (red and blue contours).
Notice the very strong positive anomalies extending from California to the North Pole. A very strong block (denoted by the black arrow) appears to be going to set up shop there. Such a strong blockade would cause very cold air to flow out over the US in the long range. The troughing remains elongated from the right parts of the North Pole towards eastern Canada. Finally, some weak blocking can be seen over the Atlantic sector as well, but the signal appears to be weak at best.
Interestingly, this situation does show quite some similarity with phase 7 of the MJO given above, notably the blocking over western Canada and troughing to the southwest of Alaska. This would make sense if the GFS MJO forecast of a few days back would come to fruition. And in this way, the signal of Atlantic blocking is reflected in the MJO as well.
Closing the scene – mixed signals?
Now that we have seen all the confusing signals, it is good to summarize them and link them together. Here we go:
1) The northern Atlantic Ocean continues to be cooler than average, and the subtropical Atlantic warmer than average. In 2015, this has been reflected by a strong positive NAO pattern (strong low pressure near Iceland, strong high pressure near the Azores). With the SST pattern to persist, one could argue that troughing will prevail near Iceland, giving unsettled weather as a consequence. However, this relationship does not have to be a cause-effect one.
2) El Nino remains very active.
3) The MJO is currently active in phase 7. While MJO composites do not seem to make much sense for the time being compared to the current pattern, they appear to be becoming more and more prevalent in the future if the MJO stays in phase 7 as the GFS forecasts. This would point to a block over the Northern Atlantic, destructively interfering with the first point.
4) The AAM budget in the atmosphere is very high and forecast to stay high for the next few weeks.
5) The upper stratospheric polar vortex does not show any signs of weakening rapidly as of yet.
Where does this all leave us? Based on persistence, one could argue that to some extent low pressure will continue to dominate the scene near Iceland. However, this signal is more of a background signal with little value in the short-term (as in a yearly average sub seasonal variations could still be very large).
Judging from model ensemble forecasts and the MJO, ridging above the northern Atlantic appears to be a more reasonable bet. My guess is that the Atlantic ridging scenario is the most likely outcome, though the signal is at odds with the background signal for trouhging to prevail in that region. Lso, the MJO forecast is rather uncertain as well. So all in all, the statement above is not a rock solid one to say the least. Nevertheless, it will be interesting to see whether the signals mentioned above will be reflected in a few days in the models as well!
Sources:
http://www.wetterzentrale.de/topkarten/fsavnnh.html (weather maps)
www.geo.fu-berlin.de/en/met/ag/strat/produkte/winterdiagnostics/ (stratospheric ECMWF weather maps)
http://www.nhc.noaa.gov/aboutsst.php (SSTS)
http://www.atmos.albany.edu/student/nschiral/gwo.html (GWO forecasts)
http://www.americanwx.com/raleighwx/MJO/MJO.html (MJO composites)
http://www.cpc.ncep.noaa.gov/products/precip/CWlink/MJO/mjo.shtml (MJO forecasts)
-
4
-
-
21 hours ago, Earnest Easterly* said:
This post may be useful.
https://forum.netweather.tv/topic/84572-atlantic-storm-4-desmond/?do=findComment&comment=3297338
In addition to my post back then, another crucial factor which is mentioned a page back (in the thread above) is the presence of an atmospheric river as suggested by Thunderbolt. Along with the deep southwesterly flow from the tropics, bands of very deep moisture were transported towards the UK over and over again. This is nicely envisaged in a water vapor image made back then.
Water vapor image on 5 December, 12Z.
Note the band of moisture-rich air (green and yellow colours) reaching from around Florida all the way via the UK towards the Baltic states.
Moisture-rich air in winter
In summer, moisture-rich air is quite frequently seen. However, in winter this is not the case. The only way in which such moisture-rich air can reach the UK in winter is by being transported from the tropics. So if the flow is due west (instead of southwest as was the case in much of December), such atmospheric rivers (or conveyor belts) are much less frequently seen.
I hope this information is of some help! If you have any other questions just ask.
-
1
-
-
As Knocker mentions above, we are bound to see a rather unsettled spell of weather the coming days. Looking at the ensemble forecasts, there seems to be an elevated chance on storms hitting southern parts of the UK and the Benelux starting from Thursday.
ECMWF ensemble wind gusts forecast [m/s] for De Bilt (NL) as of 12Z 01-01.
A number of members (including the operational) are hinting on wind gusts above 40 miles per hour in De BIlt, roughly in the center of the Netherlands. Note that the green lines all have relatively low resolution, so the true wind gusts in these ensemble members could be even higher. There remains a lot of spread, but a storm is very likely to occur between Thursday and Friday.
ECMWF ensemble wind direction forecast [m/s] for De Bilt (NL) as of 12Z 01-01.
Finally, also the southwesterlies are set to return, and with great consistency at the long term given the narrow bandwith in the ensembles. Mild seems to be the main theme, though not as mild as the record-shattering December has been.
Source:
http://www.weerplaza.nl/15daagseverwachting/?type=eps_pluim
-
4
-
-
Some interesting developments have been going on both tropospherically and stratospherically. In fact, models seem to be keying on a polar vortex split after abot 10 days below the 30 hPa level. However, this is definitely not looking like a SSW (sudden stratospheric warming). In fact, it is looking more lik a bottom-up process. How does this seem to be unfolding?
High pressure from below
The process appears to start from below this time. As widely discussed in the Model discussion thread, in a few days a ridge is expected to develop near Scandinavia. This ridge is also visible in the lower stratosphere:
ECMWF 100 hPa heigts at T+72. Run from yesterday 00Z. Source: FU Berlin.
However, in the mid- to upper stratosphere, little evidence of this ridge can be found initially.
ECMWF 30hPa heigts at T+72. Run from yesterday 00Z. Source: FU Berlin.
So the high pressure 'forcing' here is clearly coming from bottom-up. Also, clearly no signs of warming (red or orange colours) are visible at all at this height. The polar vortex at this height looks nicely circular, with only a slight displacement notable towards Greenland.
Split underway?
In the 10-day timeframe (so about 9 days from now), even more interesting developments appear to be taking place:
ECMWF 100hPa heigts at T+240. Source: FU Berlin.
The high pressure area near Scandinavia has broadenend, and it is getting help from the 'other side' (near the west coast of the United States). In this way, the polar vortex appears to be splitting into two distinct centers, one located near Greenland and the other over eastern Siberia.
This development also appears to be reflected in the upper air:
ECMWF 30 hPa heigts at T+240. Source: FU Berlin.
Although little sign of true ridging is apparent near the European continent, there is some ridging evident near the eastern US. Furthermore, the polar vortex higher up is also becoming stretched twoards Greenland and eastern Siberia. However, also note that no real warming signal is present either way.
Conclusion
All in all, very interesting developments are occurring both tropospherically and stratospherically. In this case, it appears to be a bottom-up procedure. What the consequences will be of this intriguing development in th eupper stratopshere and lower troposphere remains to be seen, perhaps some of the experts here may reflect on this!
-
9
-
-
- Popular Post
On 22-12-2015 at 9:16 PM, Vorticity0123 said:A setup to winter weather?
With such a setup forecast, a high pressure area at the surface near Scandinavia is a distinct possibility. Does that also mean that winter weather is on the way? The answer is most likely not. But why?
For the reason why it is useful to look at the ECMWF and GFS for 10 days out:
ECMWF (left) and GFS (right) 500 hPa heights (colours) and surface pressure (black contours) 12Z T+240. Source: Wetterzentrale.
The plots given above are for 2.5 days further out than the stratospheric charts of the ECMWF presented above.
In both cases we see the polar vortex nicely represented at 500 hPa as well by the purple colours (very low heights, so intense troughing). Both charts also show something of a Scandinavian/European high pressure area. But both charts are definitely not suggesting anything wintry. These charts would result in a continuation of south-westerlies instead. Why is that the case?
The ‘block’ is in both the ECMWF and GFS located too far to the east to be of much influence on the weather in Western Europe. It only tends to hold up approaching low pressure systems from entering Europe, instead sending them northward towards Iceland. The troughing over the Central Atlantic, on the other hand, is able to exert its influence over Western Europe. As we are going to be located in the upper branch of the troughing, the consequence is again mild southwesterlies.
Some interesting developments have been going on in terms of weather models during the past day or so. While chances on wintry weather are still not remarkably high (especially given the ensemble forecast of the ECMWF presented by many), chances have definitely increased since about 3 days back.
At that time I wrote about the (lack of) chances on wintry weather for the extended timeframe (about 10 days from then). However, now the odds have definitely turned somewhat. Have the models changed dramati\cally during the past few days? Or are the changes hidden in details? Time for a small recap!
The big picture - still about the same?
Here we compare the charts above (from 3 days ago) with the charts of today (EC12 and GFS18) for the same time frame, Friday the first day of 2016.
ECMWF (left) 12Z and GFS (right) 18Z 500 hPa heights (colours) and surface pressure (black contours) for Friday 1 January, Source: Wetterzentrale.
The main 'building blocks' of both charts look quite the same. Deep troughing (purple colours) is forecast to be present near Greenland and further southward, whereas a strong ridge of high pressure (yellow and orange colours) extends all the way up to Scandinavia. One could say that the ECMWF run of 3 days ago does deviate significantly with a much less pronounced ridge, but still to some extent ridging is present over central Europe.
It is all in the details
So if the big picture looks roughly the same, the difference has to be in the small things. The main factor appears to be the extent ridging is able to extend its westward influence. Whereas about 3 days ago every run kept the high pressure area over Scandinavia too far east and south to establish a cold easterly feed towards the UK, today some runs are suggesting that the influence of the ridge is able to extend far enough westward to bring real cold to the UK.
It has to be said that there are definitely some more small differences (like changes in positioning of centers of high and low pressure, undercutting or not etc.), but the difference noted above appears to be the most crucial one to me to explain why some runs are suggesting wintry weather over the UK and others not.
So... could we have seen this coming?
To answer the question, it is good to take a look at the broad picture. With a ridge forecast over Scandinavia one always should keep in mind that there is a slight, but significant chance on an easterly flow reaching the UK. Although none of the models back then forecasted an easterly, critically put one could argue that a very small correction of the whole pattern westward could turn the tides considerably. Therefore, even though the models suggested otherwise, I think it was possible to realize that there would be at least a slight risk on wintry weather.
Back to reality
Even though the trend has been for chances on cold weather to increase, the chances are still marginal at best. Furthermore, it is worth remembring that any shift to the left or right will have large implications on our weather. It could be the difference between a cold easterly and a mild southwesterly. Nevertheless, we are bound to see an interesting period of weather watching!
-
19
-
4 hours ago, BrickFielder said:
This elongated pattern I think should set up some opportunities for high pressure blocking in the near future which may set us up for a warming later.
Wave 3 Pattern possibly coming up.
Wave 2 Patern to follow.
Ideally they should be further north though. Plots are from the winter diagnostics link mentioned above.
Thanks for the great posts all, they really help to improve our understanding of stratospheric meteorology! Keep up the good work.
The plots shown above do raise a few questions for me though. Previously these plots left me completely confused, but now I think I am closer to understanding them. First, I'll start off with trying to explain them as far as I am able to myself.
Potential temperature, stability and potential vorticity
If I understand them correctly, the plots show the potential vorticity amounts at the 380K isentropic (read: iso-potential-temperature) surface. In the stratosphere, the potential temperature increases rapidly with height. The same applies for potential vorticity.
In the troposphere, potential vorticity levels generally stay rather low (around 1 PVU) mainly because the temperature profile is not very stable. Once the stratosphere is reached, the potential temperature increases rapidly with height. As a result, the potential vorticity increases rapidly with height as well (due to high static stability). The point (the height of the tropopause) where this happens depends on the pressure below this height. In general, troughing implies a low tropopause height whereas ridging indicates a relatively high height of the tropopause. There are two main reasons for that.
- In the example of troughing, the tropopause is reached very quickly. This means that temperature profile becomes very stable at a low altitudes. (and thus that potential vorticity increases rapidly with height starting from a low altitude).
- Troughing is always associated with high values of relative vorticity. This means that potential vorticity is high in areas of troughing as well.
Where is the stratospheric vortex?
For simplicity I assume that isentropic surfaces are roughly equivalent to height surfaces.
Potential vorticity at the 380 K surface as of 23-12 00Z, T+120. Source: FU Berlin.
Based on the information above and from previous posts, I have indicated where I would roughly expect the polar vortex (inside the black line, denoted by L) and ridges ("H") would be present in the stratosphere (assuming that the 380K surface is in the lower stratosphere). High values of potential vorticity correspond to low 'heights', and low values of potential vorticity to high 'heights' (also a high tropopause height and therefore ridging below).
As a check, let's see how well this pattern indicated above matches the height pattern at 100 hPa.
Heights at the 100 hPa level (lower stratosphere) as of 23-12 00Z, T+120. Source: FU Berlin.
There are quite some simliarities between the two analyzed plots. Ridging is present in both cases over Scandinavia, Siberia and Alaska. So from this point of view the reasoning presented above seems like a sound one at a first glance.
Questions
Still, there are a few questions which puzzle me up to now.
- Does the above analysis make sense in the way presented below? Or am I thinking a wrong way?
- In the potential vorticity image we can see there is a strong gradient of potential vorticity at some places (e.g. above the Atlantic Ocean). Do these areas indicate strong temperature/height differences between these areas, and thereby a strong westerly flow.
Thanks in advance for answering these questions, and of course best wishes for 2016!
-
7
-
- Popular Post
Today the Astronomic winter has officially begun! Or well, winter… in the Netherlands we have yet reached another all-time record daily high. We have seen so many daily temperature records here that people barely notice them anymore. However, there is of course much more going on behind the scene!
Most importantly, a significant pattern change is bound to take place the next couple of days. Will it bring significant winter weather? Or are we going to see a continuation of this extreme mildness? Of course much will change over the next few days regarding the outcome, but still we can definitely say some specific things about the weather to expect. Before doing that, I would like to take you through a tour showing just how unique the warmth is we are experiencing. Time to dive into the Spring month called December!
A crushing month
A record-warm December month is what this month will certainly be. But this December monthly record is not going to be broken, it is going to be literally crushed. And that is something we can say 9 days before the closure of the month. The previous December record high mean temperature stood at 7.3*C, set in 1974. Currently, December 2015 has a mean temperature of 9.6*C, a whopping 2.3*C above the previous record. And this is not going to change much, judging from the latest ECMWF ensemble:
ECMWF temperature ensemble for De Bilt, the Netherlands from the 00Z run of 22-12. Source: Weerplaza. The blue line denotes the average temperature for December.
The black line indicates the mean temperature that one can roughly expect averaging all the members. This temperature equals about 9*C. Applying a rough calculation, this would mean that the final temperature will reach 9.4*C, which is more than 2 (!) degrees above the previous all-time mean temperature high for December.South-westerlies “ohne ende”
It has been windy during most of December, but most impressive is the prevailing wind direction. The image below shows this:
Wind direction and -strength for De Bilt, the Netherlands for December 2015. Source: KNMI.
It will not get much more south-westerly-dominating than this. About 90% of the time the wind has had a southerly component. Roughly speaking, the source location of the air has been’ tropical’ most of the time, originating from the seas near the Azores. These locations aren’t standing out for their cold winters weather to say the least.
Given all this, it seems clear that lots will be written in the media about the unpreceded warmth in the coming days. I’ll provide a short update once this record-breaking December has come to a close.
Polar vortex on the move
From looking to the past we are now going to turn our eyes to the future. As Nick alluded to in the previous post, one of the most significant changes taking place is the position of the (lower stratospheric) polar vortex.
100 hPa heights for today 00 UTC as analysed by ECMWF. Roughly, the center of the low pressure area indicates the location of the polar vortex.. Source: FU Berlin.
For now, the Stratospheric polar vortex looks to be rather circular. However, things are going to change a lot, as we can see 8 days later:
100 hPa heights for T+192 (8 days out) as forecasted by ECMWF 00Z run of 22-12. Source: FU Berlin.
The first thing that shows up is that the polar vortex will be by far not as circular as it is now. In fact, its main centre has moved southwestward towards Greenland. It needs to be stressed that this is all is not caused by a SSW.
From zonal to blocked?
Often, such pattern changes in the stratosphere result in amplification of the flow near the surface as well. This means that the flow starts to be more north-south or south-north oriented instead of east-west. In other words, the Jetstream starts to meander a lot. This is also what we are going to see happening as well.
For us, the most important ‘consequence’ of this all is that ahead of the polar vortex, high heights start to build at this level giving credits to believe that this will also lead to a significant blockade at the surface in the proximity of Scandinavia. So far, December has represented high pressure over Central Europe. So what are the differences compared to what we have seen during the first parts of December?
1) Low pressure activity is more active near Greenland and to the south.
2) High pressure activity over central Europe is anchored slightly more to the north (though the exact location remains to be seen).
A setup to winter weather?With such a setup forecast, a high pressure area at the surface near Scandinavia is a distinct possibility. Does that also mean that winter weather is on the way? The answer is most likely not. But why?
For the reason why it is useful to look at the ECMWF and GFS for 10 days out:
ECMWF (left) and GFS (right) 500 hPa heights (colours) and surface pressure (black contours) 12Z T+240. Source: Wetterzentrale.
The plots given above are for 2.5 days further out than the stratospheric charts of the ECMWF presented above.
In both cases we see the polar vortex nicely represented at 500 hPa as well by the purple colours (very low heights, so intense troughing). Both charts also show something of a Scandinavian/European high pressure area. But both charts are definitely not suggesting anything wintry. These charts would result in a continuation of south-westerlies instead. Why is that the case?
The ‘block’ is in both the ECMWF and GFS located too far to the east to be of much influence on the weather in Western Europe. It only tends to hold up approaching low pressure systems from entering Europe, instead sending them northward towards Iceland. The troughing over the Central Atlantic, on the other hand, is able to exert its influence over Western Europe. As we are going to be located in the upper branch of the troughing, the consequence is again mild southwesterlies.
Back to where we started: southwesterlies “ohne ende”
What we can conclude is that, despite the pattern change occurring in the upper levels of the atmosphere, the result is only a continuation of the same theme. With blocking in the upper atmosphere to be set firmly in place, the southwesterlies could last for quite some time, making after a record warm end of December also a very mild start of January a very distinct possibility. The best evidence for this can be found in the ensemble forecast for the wind direction.
ECMWF ensemble of wind direction for De Bilt, the Netherlands from the 00Z run of 22-12. Source: Weerplaza.
180 degrees indicate southerlies whereas 225 degrees denote south-westerlies. The black line is drawn to emphasize the ‘location’ of south-westerlies.
Even past the start of January, most ensemble members show a domination of south-westerlies. For example, at January 5, the chances on a southerly to south-westerly wind direction still seems to be about 80%.
This, in combination with the ‘stuck’ upper pattern and the very mild ensemble temperature forecasts given at the very start of this post, lead me to believe that for the next 2 weeks or so, the weather will be most likely on the mild side. The question is only by how much.
Concluding note
I hope with this post I have shown just how extraordinary this December has been. And that even when the ultimate weather near the surface does not change, the developments taking place aloft can still be very interesting to follow! If you have any questions, do not hesitate to ask! And finally, a nice Christmas and best wishes to 2016 to all. Hoping for an interesting 2016 weather-wise!
Other sources
For the daily records, the following sources were used as well:
-
43
-
- Popular Post
Impressive mildness
Insane, that is probably the best word to describe the weather in the coming days in Western Europe, especially in the Netherlands. We can be sure that some daily records for temperatures will be broken the next few days. To show how mild mild can be, look at the ensemble forecast of the ECMWF below:
ECMWF ensembles of De Bilt, the Netherlands from yesterday 12Z run. Source: Weerplaza.
For clarity, I have put the daily average maximum and minimum temperatures in red and blue lines, respectively.
The coming days, the average maximum temperature will be in the double digits, up to 8 degrees above normal on Thursday. And also on the long term it seems that the temperature will stray close to the 10 degrees mark. Narcisses are starting to flower already.
Even more impressive is the minimum temperature. Because we are entrenched in a mild and humid southwesterly flow, most days stay cloudy. As a result, there is almost no diurnal cycle. And this results in minimum temperatures of more than 10 degrees (!) above normal. Such temperatures at night would not be misplaced in an average Dutch summer.
No significant change in the pattern for the time being?
For the time being, it looks that this pattern is not going to change, judging from the 8-14 day anomalies from NOAA.
NOAA 500 hPa heights (green) and anomalies (red and blue) for 8-14 days forward from 14 December.
All model ensembles generally agree with that scenario. The main pattern remains a southwesterly feed due to anomalous troughing over the western Atlantic and anomalous ridging over Europe. As a result, our source of air remains located near the Azores.
December record overwhelmed?
Most impressively, it looks like our heat record of average temperature in December will be litterly shatterred. On average, the December temperature up to now has been 8,5 degrees, 1,2 degrees above the previous record from 1974. Usually, the average temperature would drop steadily as we progress more into December, but judging from the ECMWF ensembles above it seems like the average December temperature will only rise. At least until Christmas the average daily temperature will hover around the 10 degree benchmark.
Therefore, it is almost certain that we will beat our Dutch average temperature record for December. The question is: will it be beating or shattering? A difference of more than 1 degree between the old and new record is definitely a sound possibility. This "Winter" is looking more like Spring for the time being, very impressive to say the least!
Courtesy to weergegevens.nl/ for data about temperature records
-
19
-
59 minutes ago, Somerset Squall said:
Melor did not strengthen beyond 115kts before it's initial landfall yesterday. However, it has done something unexpected. As it threads it's way through the islands of the Central Philippines, it has strengthened and attained an intensity of 125kts. The eye has remained over water generally over the last 12hrs, allowing for this intensification. Once Melor heads out into the South China Sea, weakening will be rapid due to strong shear and dry air.
Really impressive how Melor has been able to put up a round of intensification while being almost completely surrounded by land. In fact, before landfall an eye was still clearly visible. It is quite unusual for tropical cyclones to intensify between landmasses, though I can remember Tropical storm Fay of 2008 doing a similar thing over Florida. This does not look good for the areas which are now being hit by the cyclone.
Visible satellite loop of Melor. Courtesy: NOAA.
-
1
-
-
11 hours ago, chrisbell-nottheweatherman said:
Given the recent references in the model discussion thread regarding the effect on the weather in the UK of the vortex sitting over Greenland, which I imagine is related to El Nino via. its effects on the vortex, I find myself wondering whether El Nino can explain the seemingly unmovable Euro high. Is there any research that supports my speculation?
If one would be able to explain the abundance of high pressure over the European Continent with El Nino alone, we would be able to make excellent seasonal forecasts of the weather in Europe only by the presence or absence of El Nino alone. Unfortunately, this is not the case. So, the short answer is no, there is no evidence supporting your claim.
But there is of course much more going on behind the scenes, as I will try to show in the long answer versionJ.
Was a European high present during El Nino?
Before going into detail, it is good to investigate whether high pressure activity has indeed been dominating the scene. Here I focus on the period September-November. See below:
500 hPa heights between September and November. Created with ESRL.
Note that these are geopotential heights at 500 hPa, and not the anomalies (for clarity reasons). Higher heights roughly indicate higher pressure. The isolines (lines of equal height) are pointing northward over Europe, which means high pressure activity is dominating the scene. In other words, the isolines are anticyclonically curved, which is another way to say the same. So yes, high pressure has indeed been dominating the scene during autumn.
A wealth of factors cooperating
For further explanation, it is important to understand why it is not possible to explain for example the presence of weather phenomenon A (e.g. the Euro high) with another phenomenon (e.g. El Nino). Let us focus on the European high pressure area for now.
If we would like to explain why there is so much high pressure over the European Continent, we have to take into account a wealth of factors. For example, how does such a high pressure area develop? And from this, you could raise the following questions: What is the influence of Atlantic sea surface temperatures on the presence of high pressure over Europe? What is the effect of El Nino on the presence of high pressure over Europe? What is the influence of stratospheric conditions on...?
As you see from this example, there are many factors which could contribute to the presence of anomalous high pressure over Europe during the last few months. And the worst is: they are all interlinked as well, and in a very irregular fashion. This complex interaction between these factors makes it very difficult to explain for example the presence of high pressure above Europe.
Lights in the woodshed
Still, even though we live in a very complex world, we can still predict some things in the far future. Think of the effects of El Nino on US weather, which are relatively well documented. So there is a possibility to explain certain patterns with El Nino.
The distance issue
We can predict the weather in a few months over the US to a reasonable degree when we know the state of ENSO (whether we have El Nino or La Nina). However, unfortunately this does not apply for Europe. One of the reasons is that the direct effects of El Nino on the weather in the midlatitudes do not reach as far in a consistent fashion. The reasoning behind this is very interesting, but it is also highly complex. In short, too many factors are interacting with the El Nino effect to cause a clear and persistent pattern over Europe.
The scientific part of the story
In science, it is also well known that the presence of El Nino does not have a clear-cut effect on the weather of Europe. Some research suggests some pressure patterns are more likely to occur in certain months in winter during an El Nino, but these patterns do not correspond to the current pattern we are observing. See the link below for the article about this pressure pattern-ENSO relationship.
http://onlinelibrary.wiley.com/doi/10.1002/joc.890/full
Uncharted territory and Polar Vortex definition issues
To finalize, there are a few cautionary notes that are worth mentioning.
1) The El Nino we are observing today is stronger than ever before since at least 1980, which means that we are currently in uncharted territory. As a result, it is more difficult to anticipate the effects of El Nino on the weather in the midlatitudes, even in the US.
2) The term Polar Vortex is a term that is often misused. In short, there are two ‘types’ of polar vortices which are interlinked. The first is located in the stratosphere, and is thereby the stratospheric polar vortex. This polar vortex is almost always present in the Northern Hemispheric winter, and is often centered near the North Pole. The tropospheric polar vortex, on the other hand, is located in the troposphere. It consists much less often out of one entity (it could have multiple centers spread throughout the high latitudes). These terms should not be confused.
3) The link of ENSO on both polar vortices is to my knowledge rather uncertain, and therefore it is even hard to draw any conclusions about this relationship. Perhaps the stratospheric polar vortex does have a clear link with El Nino. Maybe somebody else knows more about this linkage?
Concluding note
Concluding, lots can be said about such teleconnections, as they are called. It never ceases to amaze how warmer sea surface temperatures in the Pacific consistently cause certain weather patterns in the US (and other parts in the world). Although we know quite a bit about them, there is much to be learned about their occurrence and their physical background. I hope this explanation, although maybe a bit extensive, helps clarifying why it is not possible to make conclusions about the statement you gave. If anything is not clear, just ask!
-
2
-
-
Yes, this was definitely a shattering hurricane season in terms of records, thanks for sharing. I guess a whole book can be written about this hurricane season. But what would this hurricane season be without a final surprise? The GFS is insisting on developing another weak tropical storm in the Central Pacific.
GFS surface level pressure (contours) and 500 hPa heights (colours), T+120 (for Friday afternoon). Source: tropicaltibits.
The ECMWF is not developing anything out of this system, so uncertainty is still high. Yet, having a tropical storm developing in December in the Central Pacific is highly unusual to say the least.
-
- Popular Post
- Popular Post
Word of the flooding and severe wind damage in Cumbria has also reached the Netherlands, some serious flooding indeed. My thoughts go out to the ones affected there.
From a meteorological perspective, it is really a situation of bad luck, as the upper-level flow is directly aligned with the position of the frontal system. This means that the frontal system does not move at all, and just stays trapped over the UK. As a result, the rain stays on the same place for a very long period of time, as envisaged by the chart below:
KNMI forecast of frontal systems and significant pressure areas as of 00 UTC 06-12-2015. Source: KNMI
As shown by the map by Nick F above, the frontal zone is directly associated with a band of high moisture values, coming all the way from Florida and the Caribbean. Such atmospheric rivers, as they are named, are often notorious for being real rainmakers.
Another reason for the high amount of rain in Cumbria is the orography of that part of England. Over and to the immediate east of Cumbria, there is a mountain range. This mountain range lifts the air flowing in from the west, greatly enhancing precipitation amounts. On the other side of the mountain, i(to the east) it is relatively dry as a result of descending motions behind the mountains.
A
Topography map of the UK. Source: Wikipedia.
Finally, this rain pattern is also well visible on radar imagery, with the west being wet and the east being dry. The same pattern is present further to the north (Scotland)
Radar image of the UK as of 21:00 UTC. Source: Buienradar.
This rainy pattern has been persistent over the past 24 hours or so, which can be nicely seen on the following radar loop: http://europa.buienradar.nl/24-uur.
It seems that this pattern will persist for the night, whereafter the rain will move southeastward out of Cumbria and Scotland. So there could still be quite some rainfall for the next few hours. Let's hope damage will be limited as much as possible.
-
13
-
- Popular Post
The astronomical winter has officially started. Or perhaps “winter” is a better indication for today, as the weather is more akin to mid-autumn here in West-Europe. Over the past few days, a barrage of low pressure areas has moved into West-Europe, bringing lots of rain, wind and swaths of warm and humid air towards the continent. While this may seem boring at first, this type of dynamical weather does have a fascinating side, at least from a weather perspective. Here I will try to present a guide through the fascinations of the current weather, and also briefly go into the weather in the long term.
Ridge of high pressure, but far from sunny weather
After a wealth of low pressure systems crossing the UK, we are now in a period of relative calmness relatively speaking. This has all to do with a ridge located over the southwestern parts of Europe.
Note that I use different charts than usual (this time from tropicaltidbits.com).
GFS 12Z surface pressure (in black lines) and 500 hPa heights (in colours) initial conditions. Courtesy: Tropicaltidbits
Looking at the surface, we can see a 1034 hPa high pressure area centered over France. Low pressure activity is located to the northwest and northeast of this system.
In the upper levels, we can also see the same pattern, with a ridge (yellow colours pointing northward) located over France and troughs extending over the Atlantic and Scandinavia (blue colours pointing southward).
And yet, we are experiencing far from sunny weather in the UK. Why is that the case?
Heated battle between tropical and polar air
The main reasons that the weather is (at the least) not that sunny is that the UK is located directly at the battle zone between two air masses. This can be seen beautifully from satellite imagery:
Airmass satellite image of Europe. Courtesy: Eumetrain.
The purple colours indicate polar air (indicated by PM), whereas the greenish colours denote tropical air (indicated by the abbreviation TM).
At the border between the two competing air masses, there is a thick band of cloudiness. This band of cloudiness is indicative of the polar front, separating polar air from tropical air (denoted by the blue and red line). To the south of this band of cloudiness, tropical air is hurled into Europe to the northeast (see white arrow).
One could imagine that having two very different air masses that close together serves as a perfect breeding ground for low pressure formation. This separating line (the polar front) has been located over the UK for a couple of days, explaining why we have seen so many low pressure areas crossing the UK.
Another nice way to look at it is to check the potential wet bulb temperatures at 850 hPa (about 1500 m above sea level). That sounds rather complicated, but it is much easier if you assume it to be an indication of the air mass. Roughly speaking, higher values of theta-e indicate a more tropical air mass. See below:
GFS 12Z surface pressure (in black lines) and 500 hPa heights (in colours) T+6. Courtesy: Meteociel
Here again we can nicely see the separation between the tropical air over Western Europe (reddish colour/ high theta-e) flanked by two regions of polar air masses to the northwest over the Atlantic and northeast over Scandinavia (blue or purple colours/low theta-e). And finally at the borders between these two air masses we have the location of the polar front and perfect ingredients for development of low pressure areas.
More of the same to come?
Will we remain in the battle zone between polar and tropical air? Will unsettled weather continue to dominate the theme? Indications are strong that this will indeed be the case. As a first guide, we will take a look at the 8-14 day 500 hPa anomalies.
NOAA 8-14 day 500 hPa heights (in green contours) and anomalies (broken contours) Courtesy: NOAA.
The first thing that shows up is that the lines of equal height are still very close together at the 8-14 day range, often indicative of a westerly flow in our regions. Also, a negative height anomaly is present near Iceland. Often, troughing already exists at that location in winter, so a negative height anomaly indicates that troughing will be even stronger in that area. Most likely this will result in a stronger west-east flow (as the pressure difference between the north and the south is larger than average). Or, in other words, unsettled weather appears likely for the foreseeable future for the UK.
Records to be broken?
We could also take a different perspective, which sheds a new light on the weather to expect in the future. For example, by taking a look at the ensemble forecast for a certain place. In this case I take De Bilt, located in the centre of the Netherlands.
ECMWF ensemble for De Bilt as of 00Z 01-12. The red line indicates the operational run whereas the grey shades stand for the spread (uncertainty). Courtesy: Weerplaza.
For comparison, I have added a red line showing the average maximum temperature and the blue line roughly indicating the average minimum temperature for December.
Things do not get much more tentative to record breaking temperatures as in this graph. For instance, for the next few days and in the weekend to come, the minimum temperature forecasted in Bilt is higher than the average maximum temperature (!) for that date. Mild appears to be an understatement here.
Therefore, one could conclude that we are most likely to reside in tropical air for the time being. The lack of diurnal cycle (or in other words, the lack of difference between the day and night temperature) suggests it is going to be cloudy most of the time. Definitely not the most favourable outlook for winter weather.
Even at longer ranges (say 8-14 days, the same period as the NOAA 8-14 day charts are given), indications are for warmer than average weather to persist. Combined with the stronger westerly flow leads me to believe that a very mild, rainy period is about to start (or even continue).
Concluding note
While winter has started, a glance at the weather map would make it feel more like autumn. In fact, the temperatures resemble October rather than December. So it seems likely we are bound for another period of unsettled, very mild weather. Though winter is there, it is still far, far away. Yet, there is still much interest to be found, as is hopefully proven in this post J.
-
51
-
- Popular Post
The weather is really feeling like autumn currently with an unrelenting westerly to southwesterly flow established over the UK. Low pressure areas frequently sweep over and to the north of Scotland, bringing lots of rain and strong winds. Who sees this pattern in November would not think that a tropical system from the Atlantic could affect our weather. Yet, though indirectly, this could be the case as a new tropical depression has given birth near the Bahamas. Here, I will present an insight in how this depression (TD 12) could influence our weather.
Short-lived system forms near the Bahamas
As mentioned before, a new tropical depression has formed in the Atlantic. More about this system (including further updates) can be found here: https://forum.netweather.tv/topic/84379-tropical-depression-12/#entry3280246. The system is forecast to recurve out to sea and be absorbed by another low pressure area in about 3 days’ time. Below is the latest track forecast of the system.
NHC track forecast of TD 12.
Absorption into an extratropical storm
The low pressure area absorbing 12L will do so just off the Eastern Seaboard. This all is visualized in the ECMWF forecast below.
ECMWF surface pressure (contours) and 500 hPa heights (shades) 00Z T+48 (forecast for the night from Tuesday to Wednesday).
The tropical system (TD 12) is encircled in black, whereas the extratropical low which will absorb 12L is encircled in blue.
The low pressure area containing the remnants of TD 12 will slowly traverse the Atlantic, as can be seen below:
ECMWF surface pressure (contours) and 500 hPa heights (shades) 00Z T+96 (forecast for the night from Thursday to Friday).
The low pressure area is located at about 65W 45N.
Blocking high pressure à over or under the block?
If we focus ourselves more towards Europe, we can see that a high pressure area lies to the west of Portugal. This high pressure area is associated with a building ridge at 500 hPa over Europe (which we have seen a lot this fall). And this high pressure area will be a key player in the future of the low pressure area containing the remains of the tropical cyclone. The difference appears to be related with a possible cut-off low which may or may not develop. To show this, here the GFS and ECMWF are compared. This time the maps are more focused on Europe.
GFS:
GFS surface pressure (contours) and 500 hPa heights (shades) 06Z T+136 (forecast for the night from Saturday to Sunday).
ECMWF:
ECMWF surface pressure (contours) and 500 hPa heights (shades) 00Z T+144 (forecast for the night from Saturday to Sunday).
The general picture is that the low pressure area is being forced over the European ridge of high pressure. For clarity, the ridge of high pressure is centered over France whereas the low pressure area is located to the northwest of Scotland.
However, upon a closer look, there is an important difference between the ECMWF and the GFS. The GFS shows a cut-off low developing from this low pressure area near Scotland (indicated in black). Coincidentally, the low pressure northwest of Scotland area is forced more to the north, enabling high pressure to build further northward. With a little bit of fantasy, one could even see a nice example of an Omega block in here.
In the ECMWF, no cut-off low develops, and coincidentally the low pressure area to the northwest of Scotland is able to move more to the south. As a result, the high pressure area over mainland Europe is not able to build up that far northward. This would imply unsettled weather to prevail over more areas of the UK.
Does this all have to do with differences in modelling of the tropical system over the tropical Atlantic? Most likely yes, but it is not the only player on the table. Nevertheless, it will be able to force the weather forecasts for Friday to Saturday to flip over the next few days, as tropical systems tend to magnify the uncertainty in weather forecasts.
Summary
A weak tropical system has developed in the tropical Atlantic ocean. This system will be absorbed quickly, but the resulting low pressure area could have an influence on our current weather by the possible formation of a cutoff low. The north of the UK will most likely remain unsettled, but the cards for the South have not been shuffled yet. Definitely an interesting period of model watching coming up with a tropical cyclone about to influence our weather.
-
17
-
Just when many thought the Atlantic hurricane season would be getting to a close, a new tropical cyclone has developed over the Bahamas. The system has been designated as Tropical Depression 12, and will be named Kate if it turns into a tropical storm.
The forecast track from the NHC recurves the system gradually towards the northeast while the system strenghens slowly. In about 3 days, TD 12 will be absorbed by another low pressure area.
Forecast track of TD 12 by NOAA.
Source:
http://www.nhc.noaa.gov/refresh/graphics_at2+shtml/084006.shtml?5-daynl#contents
-
2
-
-
- Popular Post
- Popular Post
As autumn is well underway, the days start to get shorter and leaves are quickly changing colours. So far this autumn has seen quite a bit of blocking over mainland Europe, with the ‘traffic jam’ often starting at the UK itself. As of writing, we are once again heading towards a period of European blocking. However, this time troughing is residing much closer to the UK itself. How will this situation evolve, and why is the uncertainty in the expected surface weather greater compared to average in a situation like this? You will find the answers below!
The building blocks towards yet another block
For the analysis here I will make use of GFS forecast maps from Wetterzentrale.de.
If we look at the current weather map, we can find a few hints that we are yet again going to enter a situation of blocked weather. If you are confused about the term blocking, a good guide what explains what blocked weather means is: http://www.theweatherprediction.com/blocking/
GFS surface level pressure (white lines) and 500 hPa heights (colours) 12Z run analysis. Courtesy: Wetterzentrale.de.
One notable feature is a 500 hPa trough (blue colours, indicated by the blue line) which is extending to the south towards the west of Ireland. At the surface, a rather deep low pressure area (central pressure of lower than 975 hPa) is present at that location. This low pressure will be a primary actor of the weather in the UK over the next few days.
On the other side, high pressure persists over central Europe, and also at 500 hPa height a weak signature of a ridge can be seen (orange colours pointing northward, indicated by the red line). This weak ridge will be the key to yet another block, as we will see below.
East-west split over the UK
To visualize the buildup of high pressure, we will look at the GFS forecast for Tuesday 27 October:
GFS surface level pressure (white lines) and 500 hPa heights (colours) 12Z run T+48. Courtesy: Wetterzentrale.de.
The weak ridge of high pressure over central Europe mentioned above has developed in a full-fledged 500 hPa-block oriented northwest-southeast towards Iceland (orange/yellow colours pointing northwestward, indicated by the red line). To the southwest of this high pressure area, the aforementioned trough at 500 hPa is still there (green colours, indicated by the blue line). This is also called a high-over-low situation.
For the surface, the aforementioned high-over-low situation results in an east-west split over the UK itself. This is not a northeast-southwest split as one would suggest by looking at the 500 hPa heights. Why is this the case? The high pressure area to the east of the UK is north-south oriented rather than northwest-southeast close to the UK. As a result, the expected weather pattern resembles more of an east-west split.
New ‘energy’ from the south
Just as the blockade at 500 hPa tends to move eastward away from the UK, a new ridge starts building from the south, as envisaged below:
GFS surface level pressure (white lines) and 500 hPa heights (colours) 12Z run T+120 Courtesy: Wetterzentrale.de.
Once again low pressure and associated 500 hPa trough reside to the west of the UK (indicated by the blue line). Also, the high pressure area which was previously pointing towards Iceland has weakened and moved further northeastward (indicated by the red line).
More notably, a new impulse of high pressure is becoming established from Western Europe. This is visible by higher heights (red colours) pointing northwards towards the Benelux (denoted by the red arrow).
1040 hPa high pressure area in GFS ensembles à High confidence?
One thing that struck me was the high level of confidence that is associated with the blocked pattern. Comparing the GFS and ECMWF ensembles for 6 days out makes things clearer:
http://www.wetterzentrale.de/topkarten/fsenseur.html GFS ensembles
http://www.wetterzentrale.de/topkarten/fsecmeur.html ECMWF ensembles
Both model ensembles show a strong high pressure area and associated 500 hPa ridge settling near Eastern Europe. In fact, the GFS ensembles show an area of over 1040 hPa at the surface near Belarus. For an ensemble, this is a really high pressure for such a long lead time. This implies that confidence is very high that high pressure will dominate the scene there.
The only notable difference is that the ECMWF is somewhat quicker in pushing the ridge away to the east.
The surface is the key – or not?
Even though there appears to be high certainty that the UK will be located between troughing to its immediate west and strong ridging towards its far east, the weather the UK will experience at the surface at day 6 is much more difficult to pinpoint. For example, compare the runs of the GFS, ECMWF and the UKMO for 6 days out:
http://www.wetterzentrale.de/pics/Rtavn1441.gif GFS
http://www.wetterzentrale.de/pics/Recm1441.gif ECMWF
http://www.wetterzentrale.de/pics/Rukm1441.gif UKMO
The operational runs of all models look to be reasonably consistent with ridging to the east and troughing to the west. Therefore, the confidence in the upper (500 hPa) pattern is rather high.
However, this does not mean that confidence is also high about the pattern at the surface. The ECMWF has its surface low pressure area much more to the north (to the northwest of Scotland) compared to the GFS and UKMO (to the west of Ireland). The resulting weather would therefore also be quite different.
The ensemble temperature forecast for London shows this spread nicely
Ensemble temperature forecast for London based on the ECMWF 00Z run. Courtesy: weathercast.co.uk.
The square area denotes the area discussed above for Saturday 31 October. Note that there is a large spread between the different ensemble members with respect to the expected temperature forecast in London for the 31st of October. In fact, the temperature is expected to lie somewhere between 10 and 15 degrees Celsius.
So, why is the surface forecast for a few days out so uncertain? One could come up with two main reasons.
- The UK is located at the border of two upper air systems, with a ridge to the west and a trough to the east. Any slight deviation of the weather pattern to the east or to the west with respect to the upper air pattern has got major consequences for the weather experienced at the UK.
- Even if the upper air pattern is exactly consistent, with such a feeble situation the exact positioning of high and especially low pressure areas at the surface is very uncertain.
A take home message: despite the fact that the surface pattern is ultimately the pattern that determines our weather, it is still important to look at the 500 hPa pattern. This is because the 500 hPa pattern is not influenced by factors like friction by land surfaces, and this pattern is thereby much easier to predict in the future. That is also why 500 hPa charts always show much more consistency in, say, 10 days as compared to surface charts. As a result, the 500 hPa charts are a very good guide to get a rough guide of the weather to expect in long range.
Conclusion
Once again a blocking ridge of high pressure is forecast to set up shop to the east of the UK like we have seen more frequently this autumn. While the upper air pattern seems to be quite set in stone for the next few days, the details at the surface yet have to be resolved. Therefore, even if we are stuck with a blocked pattern, there is plenty of interest to be found
.Sources:
www.weathercast.co.uk/services/ensemble-forecast.html
-
37


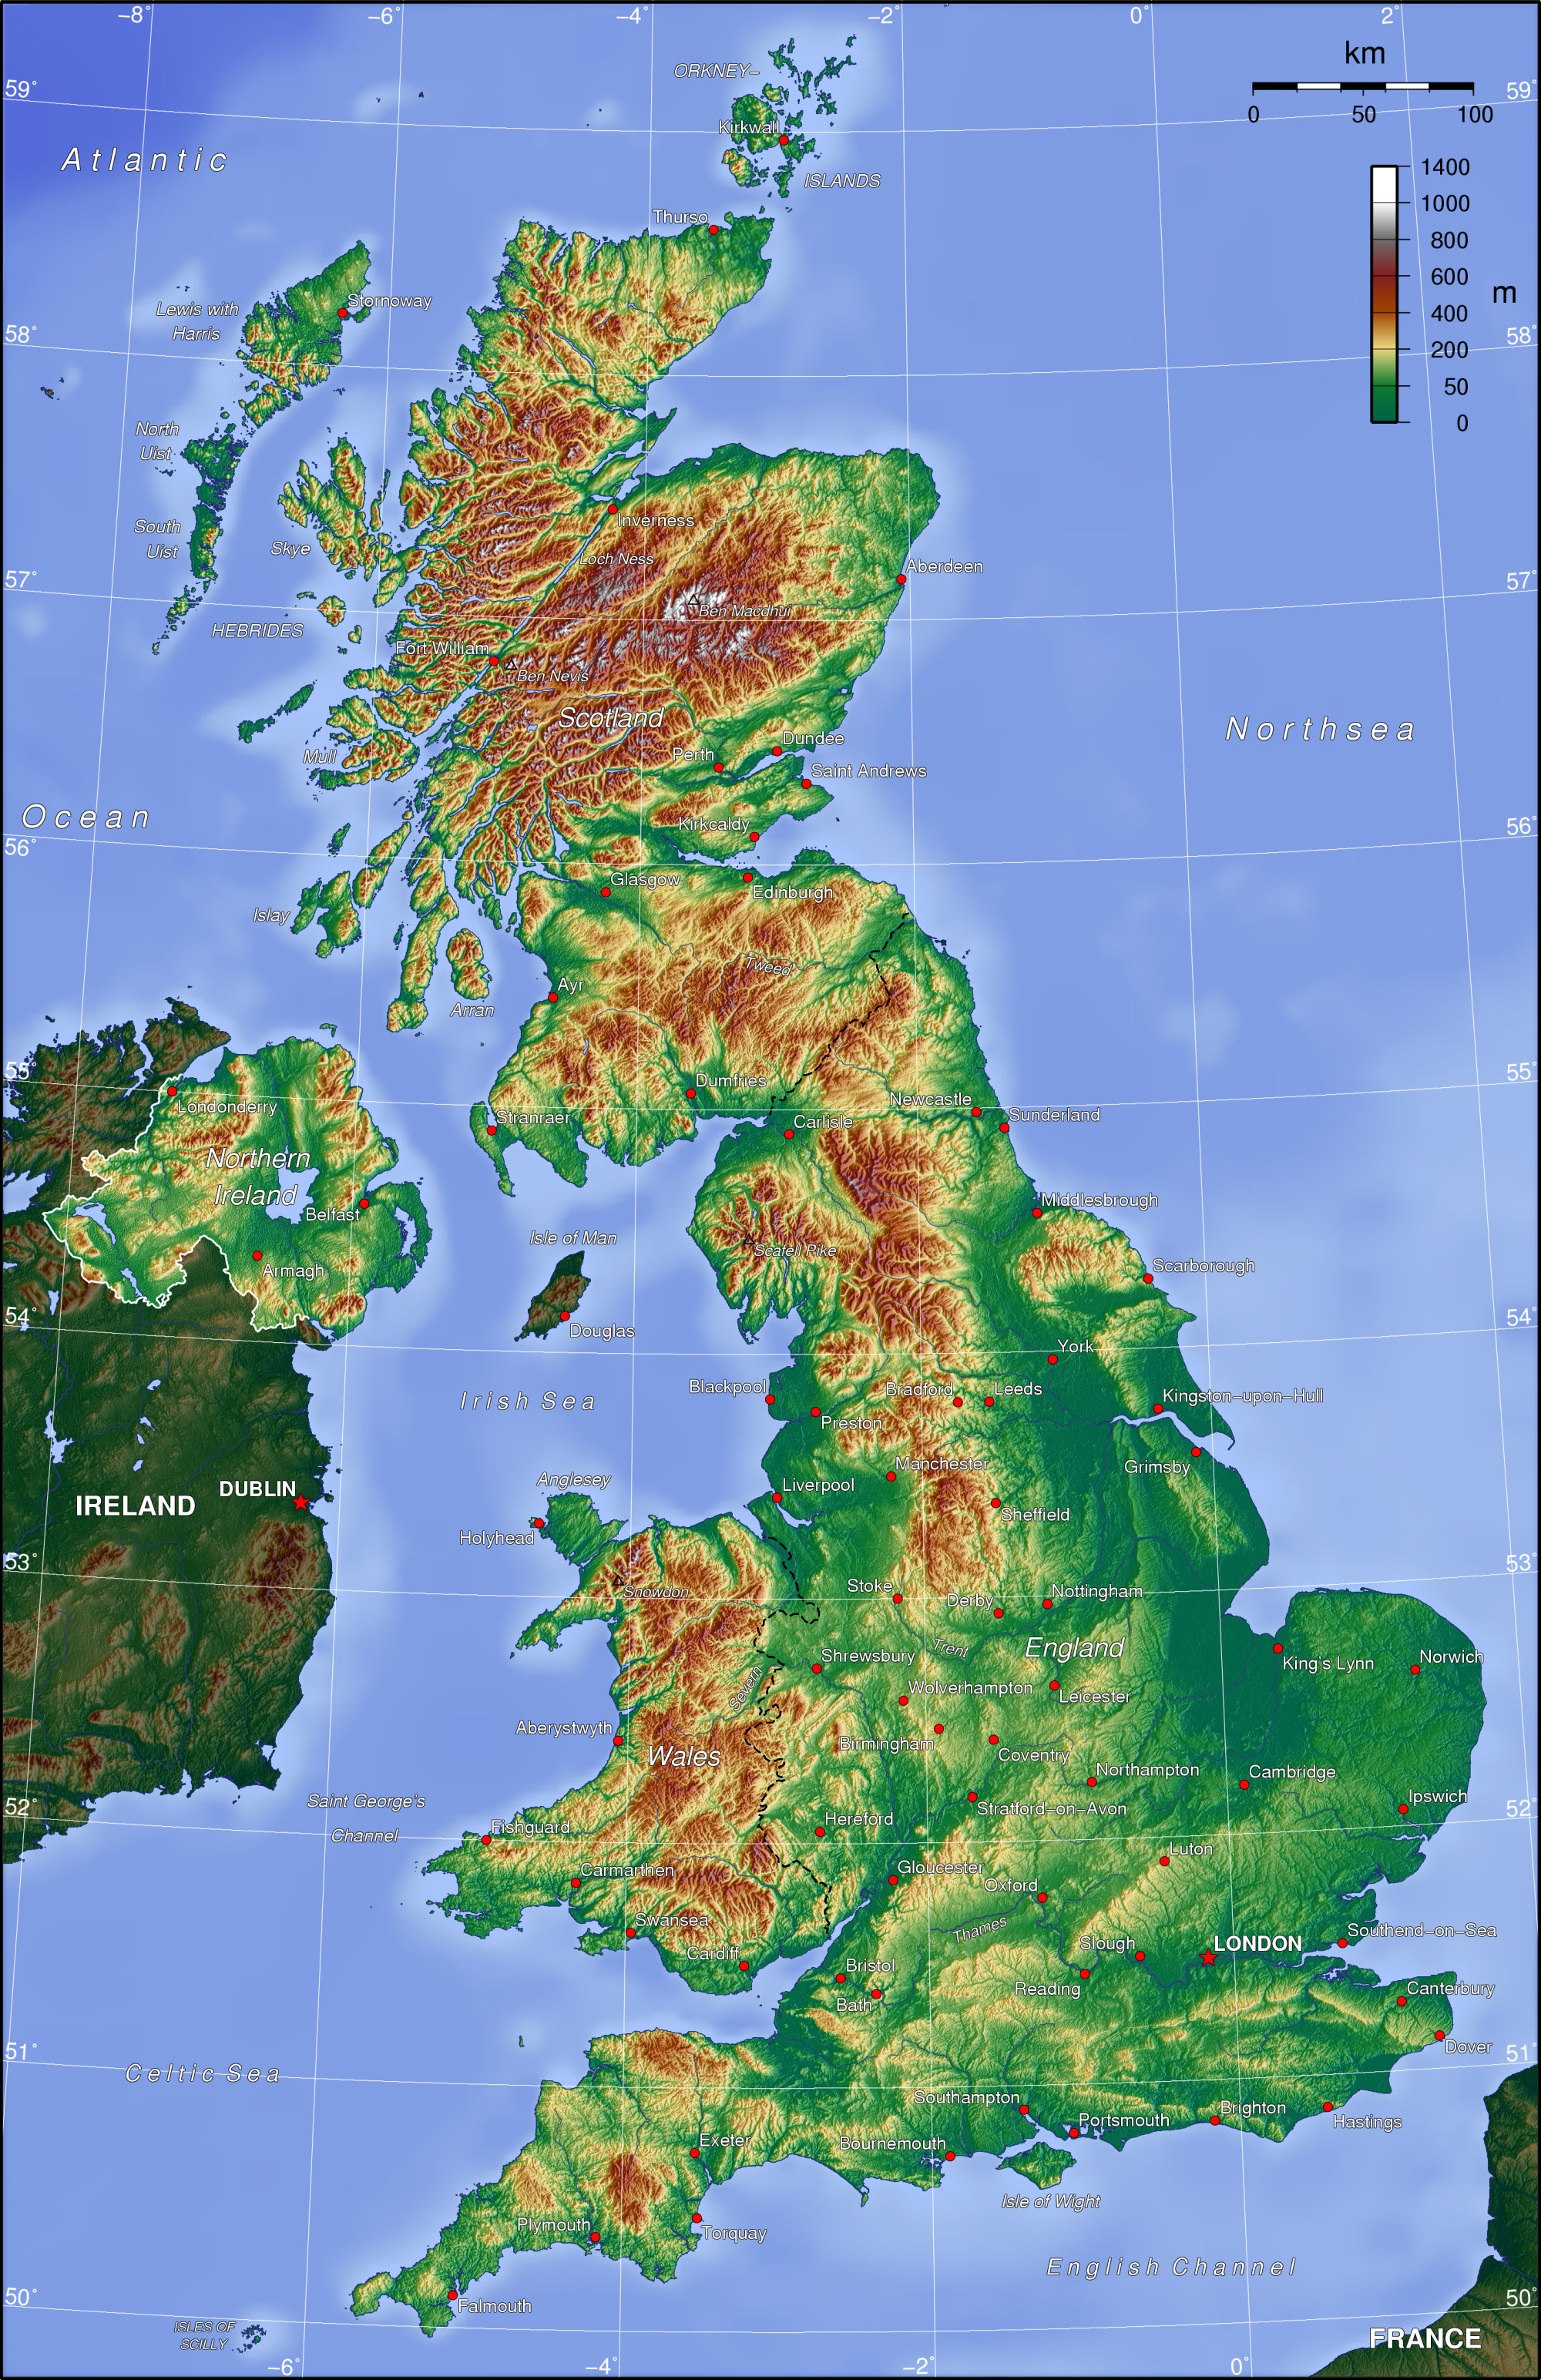
Hurricane Alex
in Hurricanes, Cyclones and Extreme weather worldwide
Posted · Edited by reef
Changed topic name to hurricane
The 2016 Atlantic hurricane season has made a very early start! Over relatively cool, 22 degrees waters south of the Azores, subtropical storm Alex has taken shape. This is the first occurrence of such event since 1978! Alex is forecast to move northwards and get absorbed into a low pressure area north of the Azores later on. In the long term it may have some implications on the weather in Western Europe in the midlatitudes.
Track forecast of hurricane Alex.
See this link for the forecast discussion. Interesting stuff to say the least!