


johnholmes
-
Posts
22,978 -
Joined
-
Last visited
-
Days Won
84
Content Type
Forums
Blogs
Gallery
Events
Learn About Weather and Meteorology
Community guides
Posts posted by johnholmes
-
-
- Popular Post
- Popular Post
I suppose I will be talking to myself but comparing 06 to 00 at extended distances really is a waste of time. Compare like with like and you will get a better idea of where the particular model seems to be heading.
I'm in the middle of doing my usual 500MB output, will post it before long but they seem to agree with the overall outlook of cold returning over the coming weekend, but with differences in how cold.
re the how far north will any low get. Almost always IF the cold has been in place for 3 days or more then the initial modelling suggesting the Atlantic pushing the ridge/cold air away is very often too quick. The direction of travel of the depression at the surface and in the 3 dimension is fairly critical and is usually only seen accurately 24-48 hours out. Even then it can be several days before there is a real breakdown into genuinely milder gets there.
-
 25
25
-
 2
2
-
 25
25
-
Dry with about half cover of shallow CuSc much of time, some sunshine, cold with a low of 0.9C, with what I call a 'dry' ground frost. no windscreen scraping and nil white showing on the grass.
-
Dry and mainly cloudy with a low of 2.0 C, no visible ground frost at all
-
Very late this morning but mostly cloudy, even the odd spot of rain during my short Sunday walk; a low of 3.3 C
-
10 minutes ago, Ali1977 said:
And by this won’t be factored in to any of the FI charts will it not, therefore ignore and concentrate on the medium range??
19 minutes ago, Polar Maritime said:Still going up..

Tends to support the idea of 'real' cold around 14 th, using the system I played around with 10-12 years ago. Only about 50% success though!
Original post: https://community.netweather.tv/topic/99706-model-output-discussion-into-2024/?do=findComment&comment=4997510-
3
-
-
Saturday 6 January re 500 charts etc
The ECMWF looks to show deeper cold air advecting south of the 500 and surface ridging moving to around Iceland area. Date shown is 16 Jan, a week Tuesday! How long the upper ridge might last here is not clear as a largish upper trough is shown on the far nw of the EC chart.
The NOAA 500 charts continue out to 8-14 with the upper ridge shown se-nw Greenland, the actual contour centre is about 55N 20W with the +ve height now shown as +390 DM over se Greenland on the 6-10 day chart. Similar on the 8-14, +ve is 270 DM. Upstream of this the pattern looks conducive to this probably extending some way beyond the 14 day period?
This pattern has been consistently shown since about Xmas Day, obviously a developing set of charts but consistent in its direction and development. Just how long this pattern will last, how cold the UK will get, let alone will it snow is for the synoptic charts to gradually converge on what is likely.
The UK surface and upper air only extend to the 12 th so obviously little of the above is on their public available charts.
Given the consistency of the NOAA charts, now being picked up by ECMWF I would be surprised if deep cold was not being forecast by UK Met before next weekend! Egg on face possible!
Usual charts below
Climate Prediction Center - 6-10 Day 500mb Outlook
WWW.CPC.NCEP.NOAA.GOV
UK Met Office Fax Charts - UKMOMSLP Analysis and Prognosis
WWW.WEATHERCHARTS.ORG
UK Met Office . . Europe and North Atlantic MSLP analysis and prognosis charts
Original post: https://community.netweather.tv/topic/99706-model-output-discussion-into-2024/?do=findComment&comment=4997528-
4
-
-
- Popular Post
- Popular Post
Saturday 6 January re 500 charts etc
The ECMWF looks to show deeper cold air advecting south of the 500 and surface ridging moving to around Iceland area. Date shown is 16 Jan, a week Tuesday! How long the upper ridge might last here is not clear as a largish upper trough is shown on the far nw of the EC chart.
The NOAA 500 charts continue out to 8-14 with the upper ridge shown se-nw Greenland, the actual contour centre is about 55N 20W with the +ve height now shown as +390 DM over se Greenland on the 6-10 day chart. Similar on the 8-14, +ve is 270 DM. Upstream of this the pattern looks conducive to this probably extending some way beyond the 14 day period?
This pattern has been consistently shown since about Xmas Day, obviously a developing set of charts but consistent in its direction and development. Just how long this pattern will last, how cold the UK will get, let alone will it snow is for the synoptic charts to gradually converge on what is likely.
The UK surface and upper air only extend to the 12 th so obviously little of the above is on their public available charts.
Given the consistency of the NOAA charts, now being picked up by ECMWF I would be surprised if deep cold was not being forecast by UK Met before next weekend! Egg on face possible!
Usual charts below
Climate Prediction Center - 6-10 Day 500mb Outlook
WWW.CPC.NCEP.NOAA.GOV
UK Met Office Fax Charts - UKMOMSLP Analysis and Prognosis
WWW.WEATHERCHARTS.ORG
UK Met Office . . Europe and North Atlantic MSLP analysis and prognosis charts-
21
-
9
-
46
-
13 minutes ago, That ECM said:
Have you got time to go into more detail?

see my post below!
-
1
-
3
-
-
- Popular Post
- Popular Post
10 minutes ago, Ali1977 said:And by this won’t be factored in to any of the FI charts will it not, therefore ignore and concentrate on the medium range??
19 minutes ago, Polar Maritime said:Still going up..
Tends to support the idea of 'real' cold around 14 th, using the system I played around with 10-12 years ago. Only about 50% success though!
-
25
-
2
-
3
-
Dry with variable cloud, temperature fell from around 4.5 C at dawn to 2.4 C a short time ago.
-
Dry and mostly cloudy, Davis showed slight rain around 0300=0.2 mm, the low from midnight was 3.6 C but it had fallen late last evening to 1.4 C, currently on 5.8 C
-
Friday 15 Jan update using the upper air charts (500 MB chiefly)
Taking ECMWF first and it has changed today from the last couple of days with both the upper and surface ridge shown as further NW than before. There is also in the last 2 days a signal for colder sir to advect west as the ridge conditions give way to a bit more cyclonic looking. 850 temperatures are brought down below -5 C in the last 2 charts. Is this a trend that will continue? Time will tell
The NOAA charts for 6-10 especially have shifted the C of G of the ridge first east and now again more west. In the more westerly position the European trough is obviously further west thus allowing the possibility of colder upper air moving west. Currently the version yesterday showed the actual contour centre in the NW of the UK with the very high +ve anomaly (+390 DM) being just SW of Iceland. The UK is currently not in any deep cold air on the 6-10 or the 8-14, although this hint at temperatures falling somewhat at 500 MB.
UK Met in the period 9-11 Jan ( their furthest public charts) show both the upper and surface ridge staying just north of northern Scotland. They have the European trough well east with a cut off upper low just south of the UK/nw France edging south over that period.
So with all 3 outputs in the 6-10 day period seem to suggest no deep cold air but with upper and surface ridging being somewhere over or WNW of northern/western Scotland. This suggests a mainly dry spell with frost becoming more widespread but depending on cloud cover for its intensity. The upper pattern to me suggests little probability further out of any break down in the block. Obviously its actual position is going to vary slightly but remaining north rather than south. Models predicting further ahead do seem to suggest that deep cold is possibly 14-20 days away from today? Not my scene so that comment may be incorrect but I’ll leave that to others to firm up on.
Climate Prediction Center - 6-10 Day 500mb Outlook
WWW.CPC.NCEP.NOAA.GOV
UK Met Office Fax Charts - UKMOMSLP Analysis and Prognosis
WWW.WEATHERCHARTS.ORG
UK Met Office . . Europe and North Atlantic MSLP analysis and prognosis charts
Original post: https://community.netweather.tv/topic/99706-model-output-discussion-into-2024/?do=findComment&comment=4996040-
1
-
-
- Popular Post
- Popular Post
Friday 15 Jan update using the upper air charts (500 MB chiefly)
Taking ECMWF first and it has changed today from the last couple of days with both the upper and surface ridge shown as further NW than before. There is also in the last 2 days a signal for colder sir to advect west as the ridge conditions give way to a bit more cyclonic looking. 850 temperatures are brought down below -5 C in the last 2 charts. Is this a trend that will continue? Time will tell
The NOAA charts for 6-10 especially have shifted the C of G of the ridge first east and now again more west. In the more westerly position the European trough is obviously further west thus allowing the possibility of colder upper air moving west. Currently the version yesterday showed the actual contour centre in the NW of the UK with the very high +ve anomaly (+390 DM) being just SW of Iceland. The UK is currently not in any deep cold air on the 6-10 or the 8-14, although this hint at temperatures falling somewhat at 500 MB.
UK Met in the period 9-11 Jan ( their furthest public charts) show both the upper and surface ridge staying just north of northern Scotland. They have the European trough well east with a cut off upper low just south of the UK/nw France edging south over that period.
So with all 3 outputs in the 6-10 day period seem to suggest no deep cold air but with upper and surface ridging being somewhere over or WNW of northern/western Scotland. This suggests a mainly dry spell with frost becoming more widespread but depending on cloud cover for its intensity. The upper pattern to me suggests little probability further out of any break down in the block. Obviously its actual position is going to vary slightly but remaining north rather than south. Models predicting further ahead do seem to suggest that deep cold is possibly 14-20 days away from today? Not my scene so that comment may be incorrect but I’ll leave that to others to firm up on.
Climate Prediction Center - 6-10 Day 500mb Outlook
WWW.CPC.NCEP.NOAA.GOV
UK Met Office Fax Charts - UKMOMSLP Analysis and Prognosis
WWW.WEATHERCHARTS.ORG
UK Met Office . . Europe and North Atlantic MSLP analysis and prognosis charts-
23
-
10
-
9
-
Hope any folk in he affected areas stay safe, even more you do not get flooded, that must be truly awful.
-
2
-
-
8 minutes ago, feb1991blizzard said:
Do you think people tend to just look at uppers and not the 500-850mb profile enough John?, -8c with 540(ish) dam heights wont cut it in my opinion, and that is assuming its snow that does fall when there is precipitation which is far from certain.
In the 'chase' for cold and snow,I do suspect this can be the case. But any prediction of ppn in any month that far ahead is often, say 2 out of 3 times, wrong for when/where/how much. That is often ignored in the hope for snow
-
5
-
1
-
-
5 minutes ago, I remember Atlantic 252 said:
think GFS underdoing precip for SE/Kent, no way will it be dry there, snowy this
Not according to the Extra skew-t for dover?
-
4
-
1
-
-
1 hour ago, Turnedoutniceagain said:
I'm still skeptical. I remember the great E'ly of Jan/Feb' 2006 - potentially an event to rival 1963 - a monster that literally disappeared from the charts with 36hrs to go. I'm still having counselling.
I love that comment, it is possible a fair number of other Net Wx coldies were also seeking help!
Nothing, at upper level suggests anything is or will change from what I've been posting for several days. Quite why so many seem to be concentrating on T+240 or even 300h is beyond my understanding.
The position of a surface high, with such solid evidence for where the upper ridge is likely to be has to be at least over the N'ern half of the UK or even further NW. Combined with the position of the Upper ridge and the subsequent development of the European trough over western Europe means that it will be cold with surface winds rather variable but probably, at least in the 4-6 day period from a NW-N'ly point and quite light. The amount of cloud is best followed by watching the Visual sat piccs over the UK area. Clear skies at night with relatively low daytime temperatures will slowly lead to overall dropping in daytime values.
Turning to the S word then probably little chance other than the odd flurry in the above time frame. Beyond that then al look at the T-phi charts for your area will give some indication of any shower activity (unstable ascents). DO remember also to factor in the necessary additions to 'will it snow', 7-8 additional variables to IF the ascents show ppn is expected. Otherwise enjoy the colder weather and hopefully those of you badly affected by our recent 'monsoon' spell a chance for conditions to improve for you.
Enjoy the count down and PLEASE be kind to each other. It could still go t--- up as 2006 demonstrated but that seems unlikely to me. I'll own up if it does and try and explain why!
Original post: https://community.netweather.tv/topic/99706-model-output-discussion-into-2024/?do=findComment&comment=4993329-
3
-
-
- Popular Post
- Popular Post
1 hour ago, Turnedoutniceagain said:I'm still skeptical. I remember the great E'ly of Jan/Feb' 2006 - potentially an event to rival 1963 - a monster that literally disappeared from the charts with 36hrs to go. I'm still having counselling.
I love that comment, it is possible a fair number of other Net Wx coldies were also seeking help!
Nothing, at upper level suggests anything is or will change from what I've been posting for several days. Quite why so many seem to be concentrating on T+240 or even 300h is beyond my understanding.
The position of a surface high, with such solid evidence for where the upper ridge is likely to be has to be at least over the N'ern half of the UK or even further NW. Combined with the position of the Upper ridge and the subsequent development of the European trough over western Europe means that it will be cold with surface winds rather variable but probably, at least in the 4-6 day period from a NW-N'ly point and quite light. The amount of cloud is best followed by watching the Visual sat piccs over the UK area. Clear skies at night with relatively low daytime temperatures will slowly lead to overall dropping in daytime values.
Turning to the S word then probably little chance other than the odd flurry in the above time frame. Beyond that then al look at the T-phi charts for your area will give some indication of any shower activity (unstable ascents). DO remember also to factor in the necessary additions to 'will it snow', 7-8 additional variables to IF the ascents show ppn is expected. Otherwise enjoy the colder weather and hopefully those of you badly affected by our recent 'monsoon' spell a chance for conditions to improve for you.
Enjoy the count down and PLEASE be kind to each other. It could still go t--- up as 2006 demonstrated but that seems unlikely to me. I'll own up if it does and try and explain why!
-
26
-
3
-
12
-
My January total is 44.6 mm; so far had 36.4 mm, which is about 82% as a quick calculation
-
2
-
-
- Popular Post
- Popular Post
Re NOAA then nothing since last evening so my comments seem okay still. I say, seem, as the ECMWF output, see below, is a bit different at 500MB from NOAA by the 12th, with it showing a more S'ly position than NOAA. This obviously means that the surface high is further south than one would expect from NOAA. I still back NOAA over ECMWF but with just a slight doubt due to this. UK Met obviously do not go out that far with charts available to us. But the low coming off Greenland does show 'their' upper and surface ridges being pushed a bit further south over the coming weekend.
Stick with the NOAA upper air charts for the 5-15 days from now is my advice. I may get egg on face but used to that!
Climate Prediction Center - 8-14 Day 500mb Outlook
WWW.CPC.NCEP.NOAA.GOV UK Met Office Fax Charts - UKMOMSLP Analysis and Prognosis
WWW.WEATHERCHARTS.ORG
UK Met Office . . Europe and North Atlantic MSLP analysis and prognosis charts
-
19
-
5
-
Dry, overcast, a low of 6.9 C, rainfall from midnight=0.2 mm; last evening 14.0 mm from 1800-2330
-
1 hour ago, BLAST FROM THE PAST said:
Aren’t the green contour lines the important ones? Get less pronounced as we go 8-14 days
BFTP
The 8-14 rarely shows as marked a response as the 6-10 does. But with both over the past week building the same pattern it would be most unusual if they turn out not to be what the 500 mb charts will actually show about 5-8 days from now and for 2 weeks or so. Don't ask me what happens after that but I would be surprised if the pattern is much altered for, stick my neck out, at least a 5-7 further days.
Original post: https://community.netweather.tv/topic/99706-model-output-discussion-into-2024/?do=findComment&comment=4991275-
1
-
1
-
-
- Popular Post
- Popular Post
1 hour ago, BLAST FROM THE PAST said:Aren’t the green contour lines the important ones? Get less pronounced as we go 8-14 days
BFTP
The 8-14 rarely shows as marked a response as the 6-10 does. But with both over the past week building the same pattern it would be most unusual if they turn out not to be what the 500 mb charts will actually show about 5-8 days from now and for 2 weeks or so. Don't ask me what happens after that but I would be surprised if the pattern is much altered for, stick my neck out, at least a 5-7 further days.
-
9
-
2
-
3
-
- Popular Post
- Popular Post
Happy 2024 to everyone
Not doing a full run down of the 500's but just posting the NOAA chart
This has been consistent with this pattern for several days. The 6-10 is not often wrong and is more often right. Since Xmas day the intensity of the ridge and its position has developed steadily. The 8-14 keeps the pattern and about the same intensity of +ve heights in much the same area.
It has gone pear shaped before but the probability is about 25%, at most. Even troughing over Europe is developed as the ridge develops. Will it snow and when-no idea, nor has anyone else.
If you enjoy watching every GFS and other model churn out x times each day, fine but a better way if you do this. Is NOT to compare T+beyond 144 hours with the latest run, compare like with like, so 00 to 00, 12-12 etc. Until down to T+144, often keep doing it for another couple of runs. When that model shows consistency AND the other outputs continue to support that evolution, including sadly the much maligned teleconnections etc, then it is a high probability that that pattern will occur.
Will it snow, just think back to summer and various models quite poor prediction of rainfall, both amount, and when and where. Not good quite often. To get snow you need about 8 additional parameters to be 'on board'. So try to be realistic
PLEASE stop carping at one another it spoils the enjoyment for all of us.
End of jh sermon, again Happy New Year, enjoy Net Wx.
-
27
-
2
-
1


Model discussion highlights
in Forecast Model Discussion
Posted
I suppose I will be talking to myself but comparing 06 to 00 at extended distances really is a waste of time. Compare like with like and you will get a better idea of where the particular model seems to be heading.
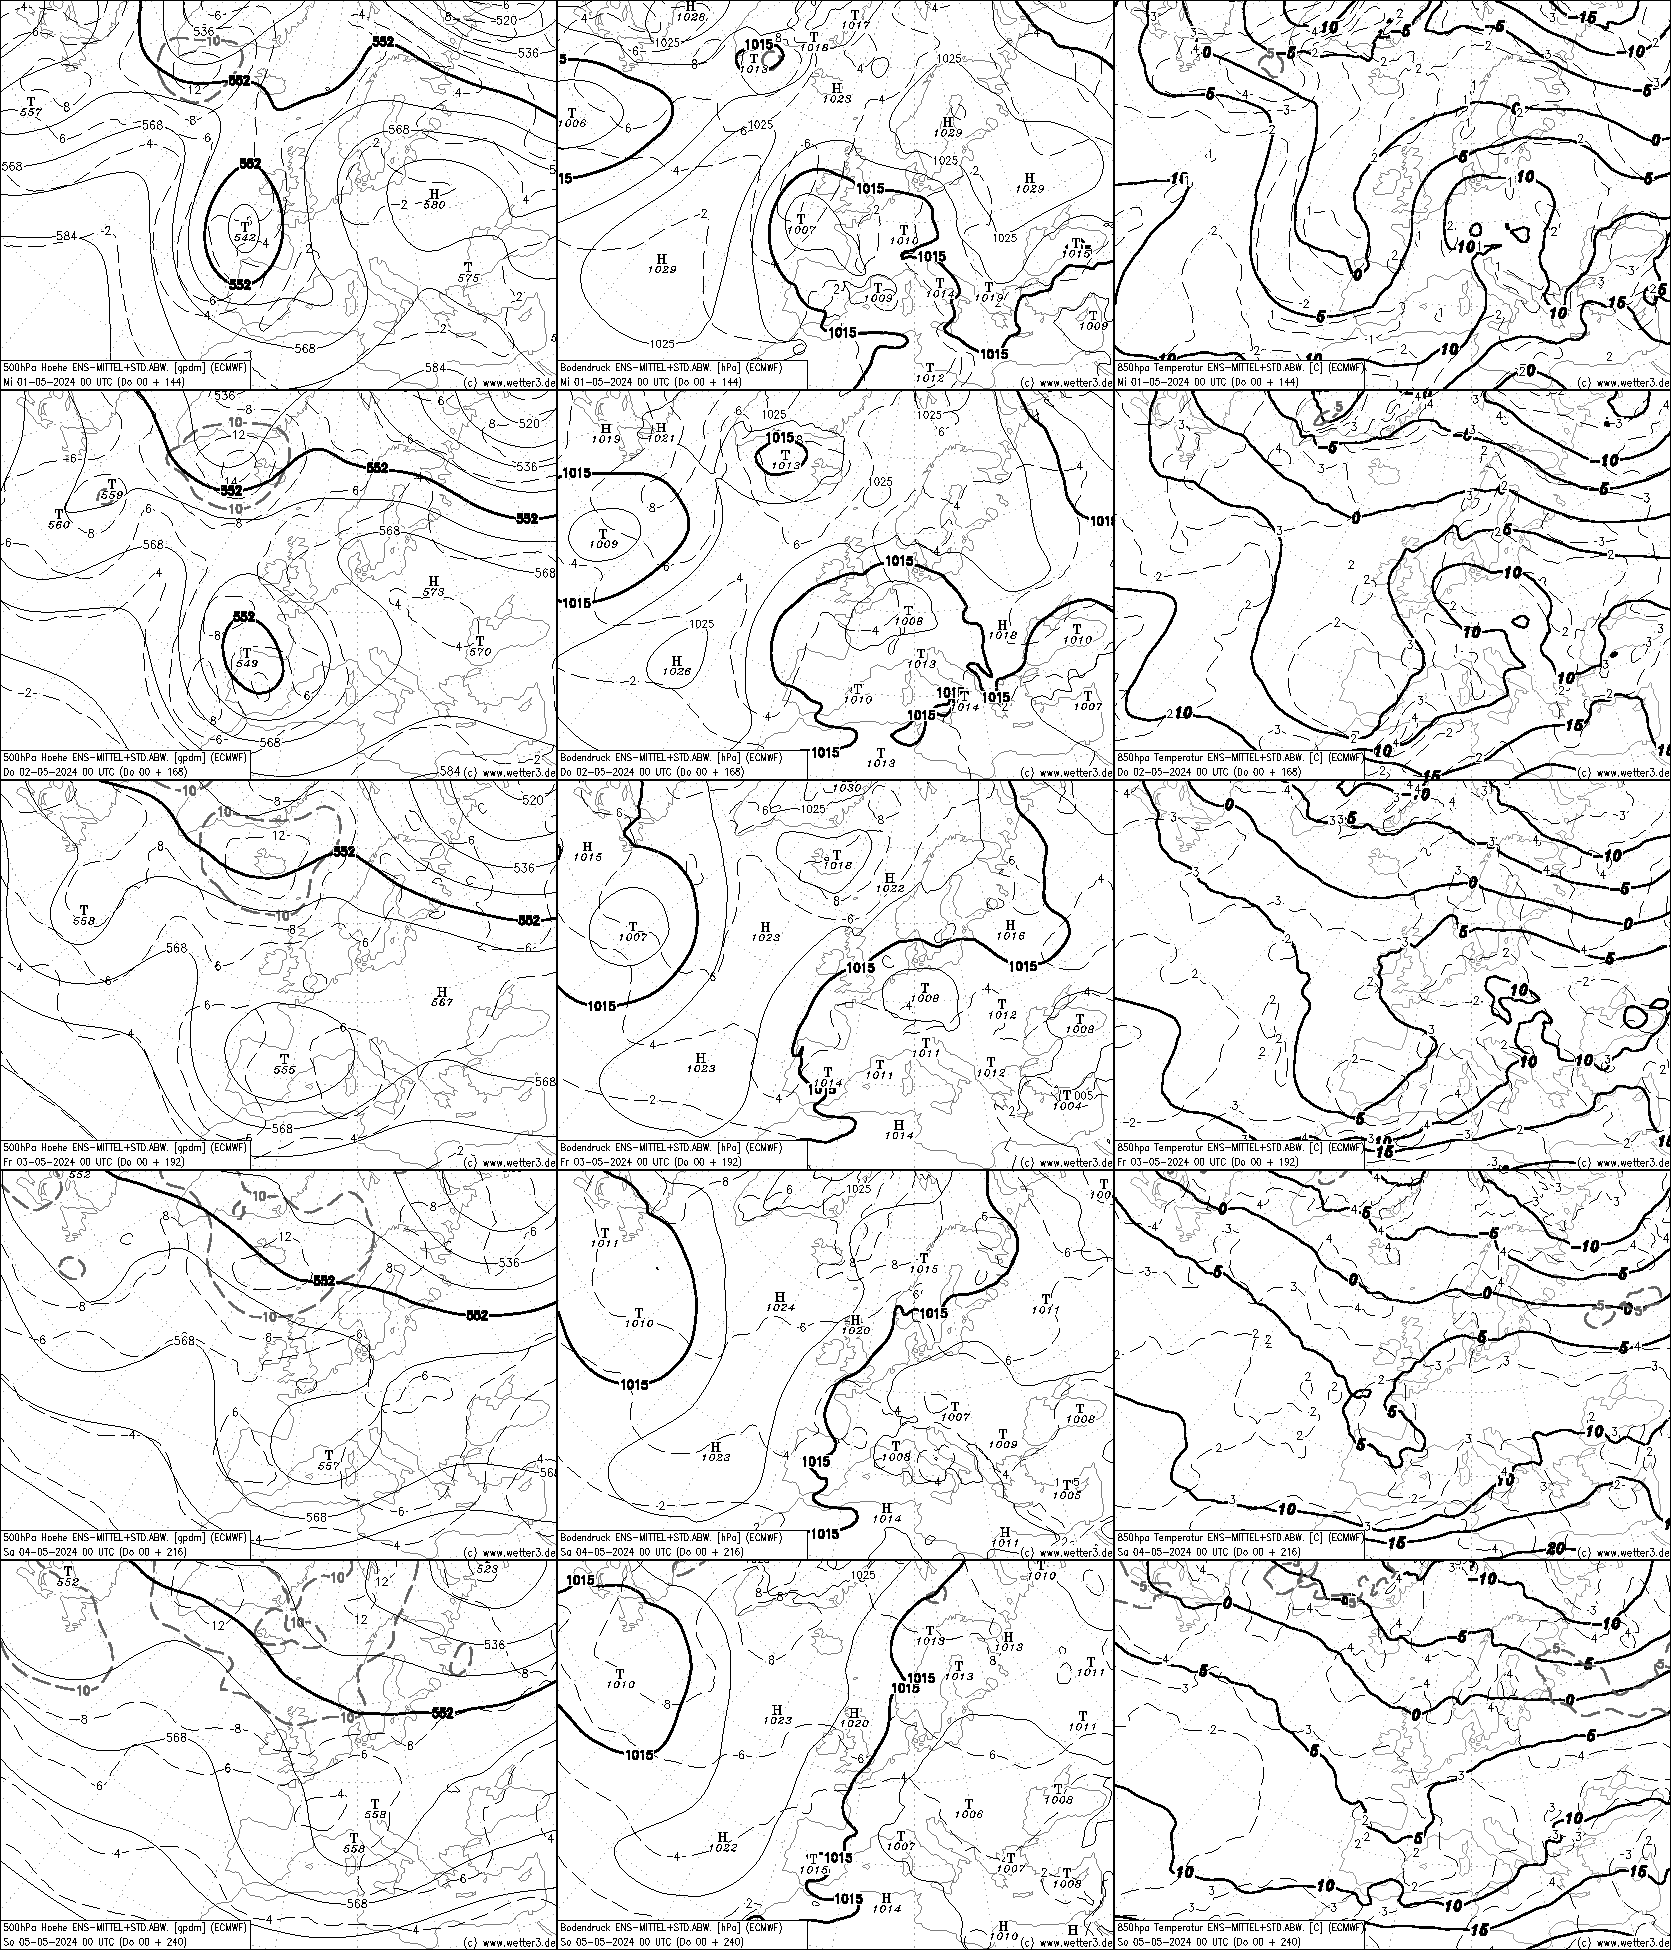
I'm in the middle of doing my usual 500MB output, will post it before long but they seem to agree with the overall outlook of cold returning over the coming weekend, but with differences in how cold.
re the how far north will any low get. Almost always IF the cold has been in place for 3 days or more then the initial modelling suggesting the Atlantic pushing the ridge/cold air away is very often too quick. The direction of travel of the depression at the surface and in the 3 dimension is fairly critical and is usually only seen accurately 24-48 hours out. Even then it can be several days before there is a real breakdown into genuinely milder gets there.
Original post: https://community.netweather.tv/topic/99706-model-output-discussion-into-2024/?do=findComment&comment=5003059