
- Popular Post


snowking
-
Posts
2,372 -
Joined
-
Last visited
-
Days Won
6
Content Type
Forums
Blogs
Gallery
Events
Learn About Weather and Meteorology
Community guides
Posts posted by snowking
-
-
ECM evolution looks much more within the envelope of expectation than the GFS.
Even more encouragingly, with the Pacific trough still very much in play (potential for record low pacific pressure it appears) and a big Siberian high, further wave activity is likely to continue to kick what remains of the PV in the proverbials.
-
 9
9
-
-
The ECM run coming out is a bit of a dream scenario for most of this region for Wednesday’s snow event with the low getting trapped and a wrap-around of the front back across the region into Thursday.
Very unlikely to happen exactly as modelled currently, but we can always hope
-
5
-
-
- Popular Post
- Popular Post
There shouldn’t just be alarm bells ringing from this most recent GFS run, there should be great bit gongs, some sort of alarming strobe lighting, and just in case that’s not enough, someone should be available in a town-cryer/Brian Blessed type role (we might have to take it in shifts) to shout that we should not take anything past day 5 right now with anything other than passing curiosity.
When we have a model run sending a low pressure system the “wrong” way, the dynamics are going to be incredibly difficult for a model to forecast with any sort of accuracy.
Fascinating watching. I still suspect the retrogression is too fast here but we shall see
-
24
-
- Popular Post
- Popular Post
2 minutes ago, Catacol said:Agreed - the timetable is racing ahead and I had expected a softening of the pattern just after New Year. At the moment it would appear not....but maybe NWP is getting ahead of itself still. However if these charts 2/3/4 January come to pass then what might follow by 6/7/8 could be pretty “significant”...!
Seconded. This evolution looks about 7-10 days or so too quick to me, difficult to know though with so much going on. Is this a ridiculously quick response to goings on in the stratosphere? Is this tropospherically led? I suspect we might see these charts continuing to stay at the same timeframe for a few days yet rather than being reeled in.
I’m also slightly sceptical of GFS output in the troposphere at the moment given it doesn’t seem to have a handle on the stratosphere at day 5 yet vs all other suites.
The overall pattern though is the one I think we’re all expecting, retrogression of heights, stronger and colder European trough, with the UK sitting somewhere close to the periphery.
If everything goes just right then we will be laughing. Lots to play out yet though so caution required
-
14
-
 2
2
-
A timely thread - although given we still look like displacing and then splitting, our impending SSW may prove an outlier for this research if it is defined as a k=1 event.
-
- Popular Post
- Popular Post
12 minutes ago, Scott Ingham said:If you are right about the strat (and i agree its just not my strongest area so needed some confirmation from an expert)
What January CET???
1? 1.5?
I’m not sure I’m quite that brave!
If we make the huge assumptions that:
1. The SSW eventually leads to a split
2. Within this split, the stronger vortex segment is the Siberian one
3. This pattern downwells into the troposphere
4. There is no constructive (or in our case, probably more destructive) interference from tropospheric amplification
5. The stronger vortex segment forces some colder air southward to our North/East
Then could we say sub 2c CET - I would say so.
But that is of course a lot of assumptions, rather than any sort of credible forecast
-
15
-
- Popular Post
- Popular Post
1 minute ago, Met4Cast said:Yes.. the current blocky pattern is trop led rather than Strat led. In theory an SSW could disrupt the pattern and shift it putting the UK on the milder side of the block.. on the other hand it could allow the pattern to double down and extend favourable blocking. We're a long way away from knowing what impact an SSW is going to have.
Indeed, the effects as of yet are unknown and any downwelling pattern and its imprint on the troposphere will remain unknown for a few weeks yet (that is of course assuming we get a full downwelling).
However in principle we’re starting from a base state of very low westerly momentum - so theoretically with just a further removal of westerly momentum through the various layers of the atmosphere we should just expect increasingly more amplified and static patterns setting up overall.
The very early idea from recent runs is that the majority of whatever remains of the vortex will be pushed towards the Siberian side of the hemisphere, which would suggest a continuation of HLB close to the Atlantic sector in some form, with the only real impact of a downwelling (assuming the majority Siberian sector vortex) to be more of a push of colder air available to tap into to our east, and more of a retrogression of the pattern close to the UK perhaps sending any HLB close to our North-East more towards our North-West. We may of course briefly see some goings-on in the Atlantic whilst any downwelling does take place temporarily before we revert to the more amplified state should any downwelling be poorly timed with continued amplification via EAMT in the troposphere. (And indeed it should be noted that recent ECM op runs in the strat, which split the upper vortex at least, the vortex segment left close to the US goes on to be nuked by a further warming wave which will only serve to restrict its influence - if any - further).
That’s my very first stab in the dark, but should be heavily caveated by saying this is me throwing my hat onto this peg far sooner than I really should and is only based on the output as it currently stands, so apologies if this ends up being wide of the mark.
-
24
-
3
-
- Popular Post
In the shorter term still great uncertainty around any snowfall potential tonight and tomorrow, but also worth keeping an eye on Tuesday, with another LP running down the western side of the country, some models (eg Icon and Arperge) swing this system into central areas - these are the sorts of features which you just can’t anticipate showing up until short notice, but make scenarios like this a fascinating watch
-
12
-
1
-
4 minutes ago, Mike Poole said:
I think there will be a full split. I’m discounting the old GFS, and am making the assumption that the reason it can’t see what is going on is because it coming down from the very top (1hPa) and it doesn’t have enough vertical resolution, I think we have seen enough model runs of this to be able to bet on a form horse, a split that looks (on the 10hPa temperatures) a bit like this:

I am inclined to agree. I think Eric is largely referring to how you define the SSW (as k=1 or k=2) at the point of reversal - but this one looks primed to split after the initial displacement
-
6
-
-
- Popular Post
I think it’s safe to say, with what will be happening across multiple layers of the atmosphere over the next 10 days, from slowing zonal winds and some serious heat flux aloft, to mountain torquing events and a subsequent very meridional/displaced jet stream and wave breaking, models will be all over the place day to day, run to run.
This is exactly the sort of scenario that ensemble runs were made for, so stick to your ensemble means for anything beyond a few days for now and the experience will be significantly less stressful for all - if anything changes on the ensemble means, @mulzy, @bluearmy and numerous others will soon let you know.
For anything shorter term, with a cold cyclonic flow over the next week or so, don’t look for anything beyond about 48 hours away and stick to the higher resolution runs (and whatever you do, don’t get sucked in to any of the GEM fantasy runs!).
Chaos will rule whilst models which are used to significantly more westerly momentum than we are likely to see for some time try to figure out where and how much to amplify the long wave pattern. So expect to see some wild swings if it’s the operational runs you are following on their own.
-
25
-
3
-
2 hours ago, bluearmy said:
Yes, too much Sherry for kris yesterday .......
Port mate, I’m a classy weather nerd...
Yes absolutely right @s4lancia thanks for spotting
-
12z ECM from yesterday still impressive:
Reversal at 1mb, Reversal at 30mb, near reversal at 10mb and poleward flux days 9 and 10.
-
5
-
-
GEFS 35 day ensemble mean takes us into negative territory - as Nick says above, still a fascinating stand off between GFS and ECM, which is even more bizarre when you consider the GFS seemed to pick up on the initial warming the ECM is now showing, before changing its mind.Either the FV3 core of the new GEFS is the new leader of the pack when it comes to the stratosphere, or the GFS is going to have to come some way back to it’s original solution.
ECM op still looking wonderful
-
3
-
-
Merry Christmas everyone, I hope you all got a snow machine in your stockings
Not that you will need one for the foreseeable
-
7
-
-
- Popular Post
- Popular Post
Yesterday’s 12z EC op going all in on a top down reversal:
And with flux just starting to turn poleward, this is only the beginning
-
10
-
1
-
40 minutes ago, bluearmy said:
Remember that the bottom up split is less reliable because it relies on the trop being modelled correctly ......however, keep an eye on when that wave(s) is ejected upwards from the trop because if that’s in a reliable timeframe all systems are go
would love to have access to eps strat data to see why they were so keen on an accelerated warming yesterday.
Yes ^^ absolutely this, thanks Nick - I should have added this into the original post. We should expect to see as much variation in the lower stratospheric forecast as we will in the troposphere given that the bottom-up action is tropospheric led.
-
1
-
1
-
-
- Popular Post
- Popular Post
This might be a good time to remind everyone that the Stratosphere charts on Meteociel will not show you whether there is a split in the polar vortex or not - the polar vortex is not just a chunk of cold air, you therefore need to view the geopotential height charts available from a couple of sources.
The easiest one to read is at over at wxcharts for the 10mb level at least:
WXCHARTS
WXCHARTS.COMA new weather forecast model data viewer for Europe and North America. Clickable forecast and ensemble plots, hourly GFS, ECMWF, ARPEGE and GEFS plotsIt combines both the temperature and the geopotential heights, as well as labelling where the vortex (L) is, and where any geopotential waves (H) are. As you can see from it's latest run, we get a lot of pressure and a big squeeze on the vortex, but no split at 10mb. You can also view a similar chart on netweather I believe for the 30mb level for free, and from memory for the 10mb and 100mb levels if you have NW Extra.
However, it's worth reminding everyone again that the stratosphere and the polar vortex do not just exist at a single pressure level of 10mb (I think the focus is on this pressure level as we use this to define whether a true SSW has taken place or not), and therefore to get a true idea of what is happening you need a comprehensive view vertically of as much of the stratosphere as possible. The best tool for this is instantweathermaps here:
GFS 50mb Geopotential Height -- Instant Weather Maps
WWW.INSTANTWEATHERMAPS.COMThis allows you to view a number of different layers of the stratosphere for each GFS Op run to try and get a true picture of how the vortex is shaping up (or not!).
What we previously saw from the outer stretches of the GFS was a top-down warming up between the 1-10mb levels pushing downwards, forcing a displacement of the polar vortex at these levels, followed by a split. Whilst we are still seeing the displacement up at these levels, we are no longer quite seeing the split (though this may follow afterwards):
There's a reason I've picked the 2mb level - it shows quite nicely why we can't just look at the temperature charts alone:
Looking at that temperature chart, if we are making the assumption that the vortex is represented just by the cold blue/purple temperatures, it looks like there has been a "split" - but as you can tell when comparing this to the geopotential heights chart above it, this is actually not the case.
However, the second piece of the puzzle has been the bottom-up warming which has likely been triggered as a result of repeated +EAMT (East Asia mountain torque) events, which is helping to weaken the vortex and allow it to be pushed around by the geopotential "waves" (the H's we saw on the 10mb chart from wxcharts above) a bit more. To see how this is developing, we need to take a look at the 100mb level and then work our way up.
What we can see when doing that is that by +336, we have a wave pushing in from the Aleutians at 100mb starting to cause a split in the vortex:
By the end of the run, the split has become even more noticable:
But if we look up at the 50mb level at +336, we notice at this point we don't yet have a split:
We have to wait until the end of the run before we see the split occur here:
So this tells us the split is working its way up from the bottom of the stratosphere.
So a few takeaways here:
1. You can't use just the temperature charts alone to tell whether there is a displacement and/or split in the polar vortex in the stratosphere - for that you need to check the geopotential heights
2. For our current event we are looking at a displacement of the vortex which further helps to weaken it, followed hopefully by a split.
3. We need to keep an eye on all levels of the stratosphere, not just the 10mb level - although of course just for beauty's sake to hit the definition of an SSW we all want to see a reversal at the 10mb level.
4. GFS has been a little less keen on the top down split in recent runs, though that's not to say it won't return again or indeed that it wouldn't happen a few frames after the +384 mark.
Hope that helps.
-
21
-
5
-
Very satisfactory ending to the 12z GFS
-
9
-
-
- Popular Post
- Popular Post
For anyone over on Twitter Wx, worth following Allan as he seems to be providing us with a rare glimpse into the EPS's take on the current stratospheric shenanigans
This actually means the EPS are more keen on a reversal than the latest GEFS:
Still plenty of distance to travel on this one, and given the current tropospheric outlook we may not even need a full reversal, but fun to watch nonetheless
-
15
-
20 minutes ago, ICE COLD said:
What’s the ECM like high up nick at day 10 ? Is going the same way as the gfs ? Cheers .
Okay well as you asked , easiest to show things at 2mb to give you a demonstration of how it’s looking. Days 9 and 10 from yesterday’s 12z:
what you can see here is:
1. The “H” is a stratospheric high pressure, or ‘wave’ pushing the vortex towards the Atlantic. This is the Wave 1 attack at the top of the stratosphere.
2. You can see the orange and red colours wrapping around the vortex - this is the warmer temperatures flowing around the surf zone of the vortex - what we want to see (and what we go on to see from the GFS days 10-16) is this temperature wave breaking the surf zone and into the core of the vortex, further weakening it and allowing it to be pushed around even more. The further away from the pole the vortex get pushed by the Wave 1, the more susceptible it becomes to any subsequent warming temperature wave - so in this instance, with the Wave 1 having pushed the vortex away from the pole, it stands a much better chance of having the temperature wave break the surf zone.
Of course this is all right at the top of the stratosphere. The next thing we want to see are these dynamics downwelling towards the bottom of the stratosphere and into the troposphere. And the GFS currently is suggestive of this happening (as posted above).
The stratosphere is a lot more complicated than just looking at whether the wind direction reverses at 60-65N - whilst that delivers a technical SSW, one is not always required to give us a desirable result in the troposphere - and particularly when we are starting from the point of a very weak tropospheric vortex already. Any damage which can be applied from above will only help the cause.
-
3
-
3
-
-
20 minutes ago, bluearmy said:
That 12z gfs op is nuts as it reverses to about -25m/s by day 15
Not surprisingly the reversal looks to be heading down to the trop on that run - although we already have a neg AO in any case
Bonkers run.
Anyone want to play spot the vortex? That’s it, over there in the pacific...what’s left of it anyway.
Vortex annihilated at the top from as early now as T+324. As a result, split down as far as 30mb, and as you say downwelling with some real purpose through the trop.
Incidentally I’m not sure why there’s been some disheartened posts about the ECM strat output - I’m liking what I’m seeing so far and certainly up to day 10 the dynamics of the warming at 1mb looks very similar to recent GFS output. Will try and post an update on this tomorrow once I’ve seen the 12z runs on the Berlin site
-
7
-
2
-
-
Slight nuances to the story today but still largely the same. The monster warming at the top of the stratosphere continues and if anything we see even more evidence of Wave 2 attack by the end of the 0z GFS forcing a split between 10-5mb and a complete removal of the vortex from over the pole above.
Less of a split noticeable below this (the bottom up action we spoke about yesterday will always be more prone to swings as this is troposphere dependent) however the core of the vortex in the lower stratosphere looks likely to shift to somewhere east of Greenland.
Two things to note from this. Firstly in the shorter term such a lower stratospheric pattern would suggest that a broad NW European trough is the most likely way forward in terms of long wave features - that isn’t to say there won’t be some of those pesky shortwave lows that spring up and scupper cold chances, but in general we would expect to see higher than normal heights around the mid Atlantic and any such areas of equal longitude.
Secondly, if you can remember back to some of the awesome 3D animations @Recretos has produced of the vortex in the past, you’ll hopefully be able to remember that a happy vortex = a vortex that is spinning away on a consistent axis right through the atmosphere, ideally somewhere close to the pole. Where as what we are likely to end up with over the next few weeks is a vortex whose top at 1mb is located somewhere over towards the US, whilst the bottom down towards the tropopause sits somewhere closer to Svalbard. This leaves us with a very unbalanced and drunk looking vortex (well, it is nearly Christmas I suppose) and means that we should expect less and less influence of a strong westerly vortex around the pole for the foreseeable future - in other words, we should expect extended spells of AO at least at neutral levels, if not negative.
That’s the minimum. What comes after that if the wave action at the top sinks down lower into the heart of the stratosphere in the first 3rd of Jan could pique the interest of those of a cold persuasion even further
-
6
-
1
-
-
10 minutes ago, bluearmy said:
gfs 12z not far off a tech ssw by day 16.
i would say reversed down to about 8 hpa
and split too !!
I'm like a kid at christmas watching this unfold
Split at every level of the stratosphere apart from 1mb - and the only reason there's no evident split at 1mb is because there really isn't any evident vortex left to split at this level by this time:
Definite Wave 2 action there right at the top, and what's left of the sorry remains of the vortex displaced right off of it's usual happy-place axis and off to the US.
It will hopefully be a really fascinating watch with some really complex interactions as the top down action meets the bottom up action, presumably somewhere between 10-30mb. What happens from there is anyones guess, but with the GEFS and GEM ENS continuing to suggest that monster HP over Asia will keep on breaking travel restrictions and head down to China, I can't imagine +EAMT letting up for particularly long any time soon, so one would suspect that once this longwave pattern sets itself up, it's not going to become particularly fast moving or deamplified any time soon, so continued pressure from the bottom up looks likely.
-
7
-
-
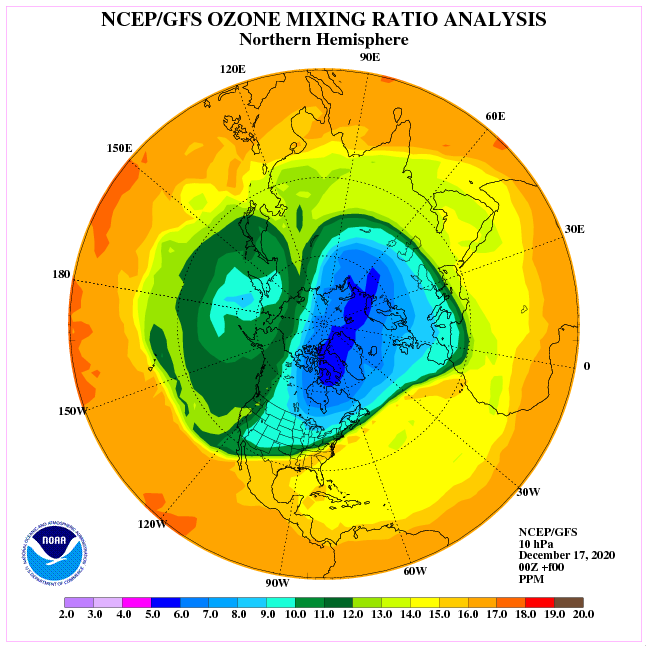
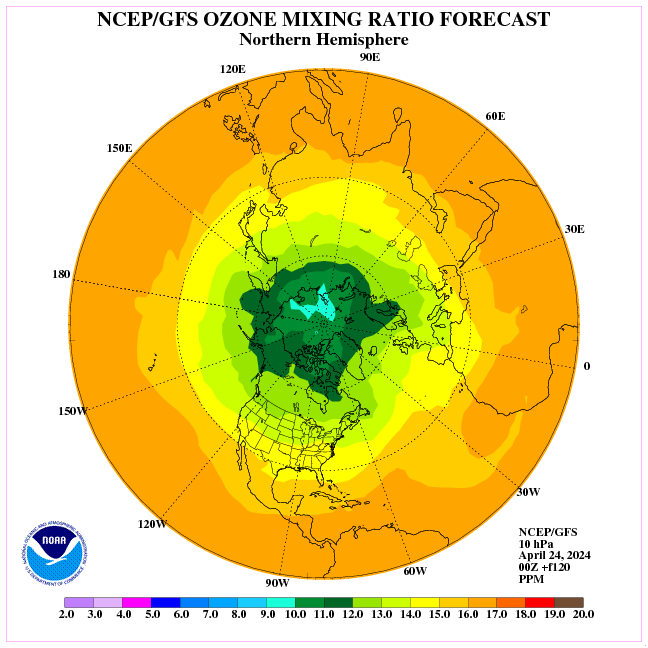
11 minutes ago, Vikos said:
Ozone concetration might be far to low for a strong SSW (by now), forecast only goes to +120h
Forecast--->
Nothing too substantial specifically at 10mb perhaps, though in fairness when looking at total ozone so far in December:
Signs there of decent transport via BDC poleward to suggest that ozone concentration is not too detached from the (very colourful) picture being painted in the stratosphere by modelling at present.


Model Output Discussion - Into the new year
in Forecast Model Discussion
Posted
In terms of timelines, even this seems a little quicker than I had anticipated, but feels far more realistic.
We can (hopefully) see from the variation in runs so far today that whilst EAMT’s and SSW’s allow us to project the broad scale pattern (retrogression of heights, continental location of troughs), the devil for a tiny little island like ours will always be in the detail - and it is for that reason that it is pointless looking beyond a few days for the exact details. Details such as how far North/West will any HLB set up will continue to ebb and flow for many more days to come yet (as will, I suspect subsequently, the mood in here!). In fact I would be surprised if we knew with any real confidence what the outcome of the ever mentioned “background signals” will be any time before the 5th January at the absolute earliest.
In the meantime, for as long as the models continue to suggest retrogressing heights and a trough dropping somewhere to our east, we know we’re at least in the game.