


Recretos
-
Posts
496 -
Joined
-
Last visited
-
Days Won
5
Content Type
Forums
Blogs
Gallery
Events
Learn About Weather and Meteorology
Community guides
Posts posted by Recretos
-
-
- Popular Post
- Popular Post
It has been a while since my last posting about the stratosphere. I remember back in the days, I was trying to be a strat modelling pioneer, making graphics that people demanded but were rare to come by. I was among the first, if not the first in the world to produce fully public HD-3D/4D polar vortex animations.
I am here again now because there is still something that people demand but it is hard to come by. It is seasonal stratospheric forecasts. Those are almost impossible to come by as far as I have searched, unless you have a fat wallet or you are full time professional.
Thanks to the Copernicus project, I now have access to stratospheric grids of ECMWF and UKMO Glosea5 models. Configuration wise, those are the best two models in the world for seasonal stratospheric forecasting. The only one that could join them is the JMA-SEAS model.So I present you four graphics for now, monthly mean forecast. Considering it is just the October initiated forecast, so we have a long lead time, and its a monthly mean of 50 members, its actually impressive. The signal is visible. I will add more graphics with time and every month with new runs. I do plan to make a permanent home eventually for these graphics to be regularly updated on the Severe Weather Europe page where I am one of the admins. Will also add 500mb monthly anomalies there in the far future.
The grids were in GRIB1 format with some non-conventional coding, so it took some trickery to produce it, but I have "cracked the code", so there is much more of this to come.
")
-
 14
14
-
 6
6
-
To do a quick update. Atlantic subsurface temps are below average just like the surface ones.
And a cross section by latitude over Atlantic at 20W and 30W for Juney showing that cooler waters are not just near the surface.
-
4
-
1
-
-
I see I still have some reach.
I do have in plan to do a post on Atlantic with some more data, like different depths and also salinity anomalies. Might also add a cross-section or two. All from the well respected datasets MERCATOR and UKMOs GloSEA5.
-
4
-
3
-
-
As far as teleconnections go, someone has stated we are in a similar situation like winters 07/08 and 95/96. Tho the difference in winter patterns was enormous. Kinda shows we are still open for business and nothing is finalised yet.
-
1
-
-
That is an interesting topic, and some studies were done about it, but i cant remember the authors or titles.
Anyhow, I decided to take a look myself at the basic raw data. Making a correlation of DJF 500mb and the atlantic ACE index prior to the winter, looking at years 1980-2016. The obvious -ve NAO tendency falls out. The correlation factor is not too high for great confidence, but its enough to show a potential signal.
So I decided to make a graphic with ACE, AO and NAO, for future reference. It is to be used to look at any specific years. There are some years that have high ACE/-ve NAO and vice versa.
So I decided to make a scatter plot. Here we can see that lower ACE years are pretty random with AO and NAO. But, as we go higher, especially above 150, the tendency for more negative -AO/NAO increases. The exceptions are 98 and 99, being strong La Nina years.
This is just raw data and a lot could be analysed further down the line.
And a bonus graphic, a correlation of autumn polar vortex with ACE. This basically shows a small indication that the polar vortex might tend to be weaker with higher the ACE goes.
-
5
-
2
-
-
SSTs can change fairly quickly with upwelling, and also in the opposite direction. Another thing is a prolonged cyclonic activity which mixes a good depth of the ocean (relatively).
Just for this thread I have made two charts, showing that the "cold" blob from 2015 is pretty much gone compared to this year. First is a direct monthly mean comparison, and second is a difference at 75m depth, where the N Atlantic is warmer than it was in 2015 in the first week of September.
-
7
-
-
For further usage, i have added the SSW markers on the graphic, coloured by their respective ENSO phase (red-Elnino, green-Neutral, blue-Lanina).
-
I was playing around with various data again, and since we usually look at ENSO, QBO and Solar cycle data, I decided to make a graphic that combines all of it in one place, as a reference to past combinations of these indices. The enso line does not correspond to any axis values, but is just there as a feeling of wether it was + or - or waning/waxing.
Here is a version without the ENSO:
And versions without solar data:
If anyone has some special graphical request, I can try to cook something up as much as its in my limited plotting power.
Regards
-
5
-
3
-
-
- Popular Post
- Popular Post
Havent posted for a while, but its time I guess, that I share a thought or two.
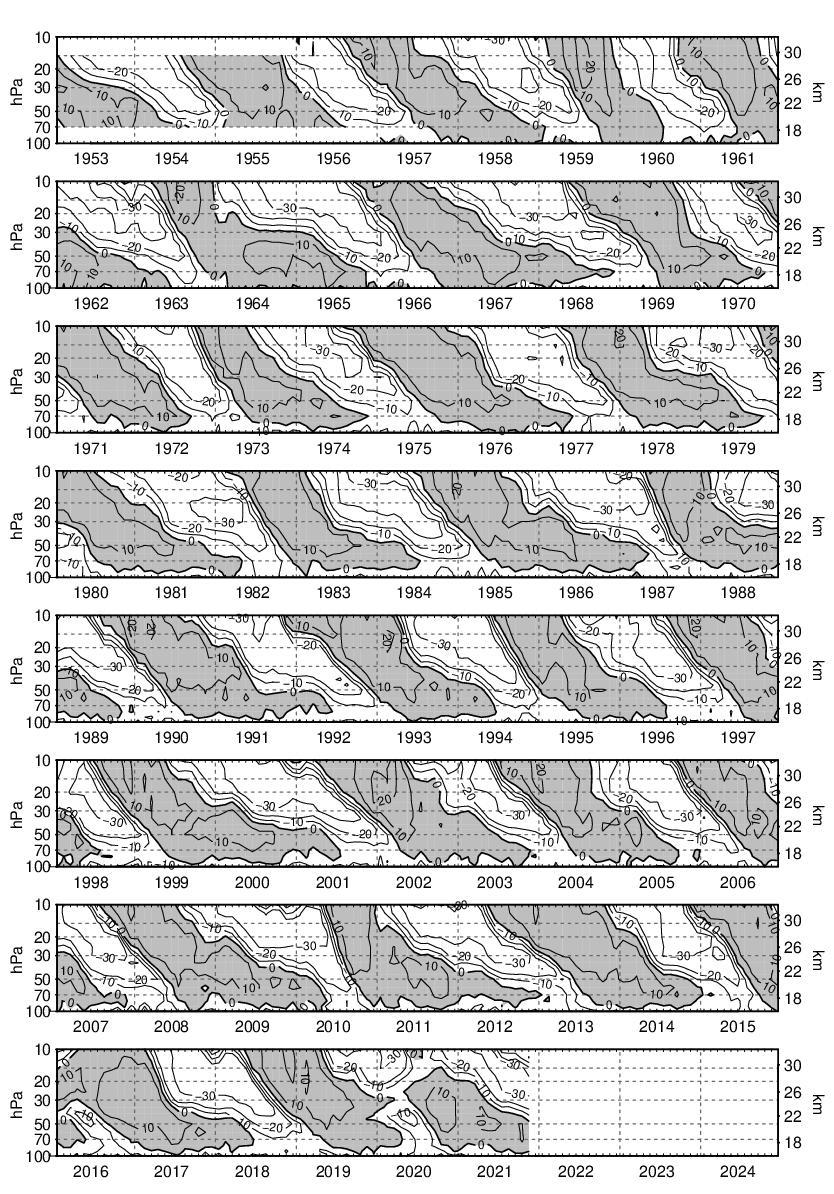
I will start off with my own version of the QBO timeseries, which I did not name the QBO, because it looks at the whole layer between 1-100mb, while QBO is mainly looked at 10-50mb or 30-50mb, depending on the use or the dataset.
I wanted this to be a high-resolution version of the FU Berlin graphic, that can be found here: FU Berlin QBO and which we are all well familiar with. The difference is, I wanted to make an HD one, in colour, and using a high resolution ECMWF reanalysis dataset, and using daily (yes daily) data, instead of monthly data like FU Berlin, because it gives a better (smoother) appearance. This is just version one of the graphic. i will update it as needed.
We see at the end of the series, that the negative values (easterlies) are moving down. Looking at a recent analysis, we do see a large area of easterlies in the mid stratosphere, going down to -40m/s in the core. The last time we had such strong easterlies in these parts of the stratosphere in late summer, was far back in 1986. It just so happens to be the same year that we were also in a "solar minima" going for a negative QBO for the winter. And the winter of 86/87 was one to remember across Europe. I am not saying that it will repeat the same winter, but am jsut looking for the closest example to current situation as far as topical stratosphere winds go.
The forecast of course begins the onset of the new polar vortex, which co-exists with the easterlies above the tropics.
Comparing the above graphics with 1986, we do see just how similar the setup above us is. The setup down lower tho, is up for discussion.
After a few years, this is probably the most exciting entrance to a new polar jet season for me personally, since there is finally something worth experimenting with.
best regards.
-
13
-
2
-
On 10. 2. 2017 at 17:49, Johnp said:
Why has the Strat thread morphed into a tiresome climate change thread?
Not just this, but a lot of the times when I get the notifications in my inbox, it looks like a twitter feed.
But there are some brilliant posts still to be found.
-
1
-
-
Here are some of 00z ensembles, going for a gradual but small recovery.
And a high resolution display from JMA GSM. -
6
-
-
I do not see any split on that ECM chart. Just normal minute deep inner core oscillation.
So either I dont have a clue about the stratosphere anymore, or the standard for what is a polar vortex split has really droped.
-
1
-
-
On 3. 11. 2016 at 20:20, Recretos said:
And here is a graphic I made, which shows latest GEFS ensemble means, and it shows a decent negative bias from GEFS, which means that in the early forecast hours it underestimates the vortex strength, which mainly has to do with the positioning, and goes too low also in the later stages, which is also a case of positioning. A thing worth noting when interpreting GEFS ens mean forecasts.
As I have showed before, the GEFS/GFS have a certain bias, where they have the vortex too weak/displaced. And now the new bias analysis showed the same thing, this one made with even more runs.
Something to consider in the future.
-
8
-
-
GEOS-5 00z from today did not have a reverse at 60N.
-
1
-
-
The control run, getting out of control on the 12z GEFS.
-
7
-
-
- Popular Post
- Popular Post
It was mainly neutral to positive, but not really into negative SSW territory. And that is the latest run that I can get for free. All the rest since that date are behind a paywall.
And here is 10mb wind speed, to show how the jet flows.
And the GEFS forecast which shows descending negative zonal means from the strat over time.
-
10
-
- Popular Post
- Popular Post
Well, 06z GEFS is not much different than the 00z, with reversal also at 60N. Here are some of my graphics.
And a funny fact, the ECM46 (old ECM32), actually had a wrong trend of strengthening the vortex. It is an older run, but as fresh as I can get it free.
And an animation I did yesterday from GFS data, showing the anatomy of the upcoming dynamics.
-
17
-
Zonal mean temperature change, showing the warming strat top, and some (seasonal) cooling in the mid-levels.
And the change of the zonal wind component, mainly showing the polar jet displacement, and a lack of any general polar vortex organisation.
Height wise, as the south pole seasonally "weakens", the north side slowly drops heights, but without any real fast height drop, exccept for the 1-8 day period due to the shifting. Which is kinda obvious by now, from all fronts why.
-
9
-
-
I have some access to the extended ECMWF EPS model, with a 3-week lag, so I made an ENS plot of the 65N zonal mean zonal wind forecasts, which show that even tho some members were seeing the weaker vortex, the ENS mean in general was not as "agressive". But in all fairness, a lot of times not even the GEFS is as perfect for 10-16 days ahead.
The most interesting part is, that the never runs will see the situation better, which might (or pretty much will) influence the ECMWF Seasonal model.
And the latest 12z GEFS, with very good agreement, with the exceptions of members 4,6 and 8.
And here is a graphic I made, which shows latest GEFS ensemble means, and it shows a decent negative bias from GEFS, which means that in the early forecast hours it underestimates the vortex strength, which mainly has to do with the positioning, and goes too low also in the later stages, which is also a case of positioning. A thing worth noting when interpreting GEFS ens mean forecasts.
-
8
-
-
- Popular Post
- Popular Post
My test graphics showing GEFS U-wind forecast relative to the Climatology.
And zonal mean cross sections from ECM compared to GFS.
-
10
-
- Popular Post
- Popular Post
A fresh latest 3D animation sequence, showing the polar vortex dynamics, and the reformation of the core in later stages, with its energy focused more on the Scandinavian sector.
-
20
-
- Popular Post
- Popular Post
As far as any splits go, first you have to define what kind of a split are we even talking about here. By no means is this a 2009 SSW super split, but merely a core split, with the outer layers still connected.
A quick look of the forecast made from GFS 3D data, showing the polar vortex cores from 150mb up to 10mb.
-
22
-
- Popular Post
- Popular Post
Nice to see a new thread open, and already filled with rich content. I will be brief, and will just drop a few of my own charts, like usually, which pretty much tell the same sad story for the polar vortex, which might be happier for us somewhere down the line.
I might drop a 3D animation or two of the current evolution at a later time this week or next, but one thing is certain: The polar vortex is not (or will not be), a happy camper in its adolescence.
Cheers.
-
24
-
Say hello to my little friend.
-
9
-


Stratosphere and Polar Vortex Watch
in Spring Weather Discussion
Posted · Edited by Recretos
Thanks guys for the feedback.")
Yes, these are monthly means and heavily diluted, and also considering its a 50-member weighted average. As far as the vortex core goes, its spatial area is much larger than any area of the potential warming onset from the Asian sector, so the dilution effect is greater on the warming part then on the cold core of the polar vortex. Not to mention that in some individual ens-member cases there likely isn't even any Asian warming occurring, so that is a heavy dilution effect, unlike the polar vortex core which is always present, just spatially shifted by a few 100-1000 kilometres. Now I am not saying that the warming signal on the ENS-mean maps is a given, but we have to consider entire model circumstances when interpreting such ensemble charts.
That is why anomalies were invented. Yes I have those too.") They are from models' own hindcast climatology. It gives a bit better impression what is the actual abnormality in the forecast.
They are from models' own hindcast climatology. It gives a bit better impression what is the actual abnormality in the forecast.
for example from the Glosea5:
And some ECMWF