
- Popular Post


Recretos
-
Posts
496 -
Joined
-
Last visited
-
Days Won
5
Content Type
Forums
Blogs
Gallery
Events
Learn About Weather and Meteorology
Community guides
Posts posted by Recretos
-
-
@Cloud10
What I am trying to tell you, is that you must consider the fact that the JMA graphs, like the NOAA graphs are area-averaged. They probably avrage the whole area from 60N-90N, Or 65N or something like that. Your estimate went up to -8, which was the maximum temp on the chart, and not what the JMA would get if they averaged the whole polar cap from 60N to 90N. Even if the very spot of the north pole at 90N would be taken it is still a too big estimate. You must average the entire area to get the temp for that graph, not just the highest temps.
")
-
 2
2
-
-
1 hour ago, Interitus said:
Good post Recretos, though with a warming like 2009 there was nothing ambiguous about an easterly zonal wind component in excess of 30 m/s on 28th January.
Also for those that might not be sure, counterintuitively the 50% north and east directions of a 10 m/s sw wind are 7.07 m/s
Thanks guys.
Well, i was giving a general example of a -1 and +1. of course the magnitude of -30m/s is on a whole different scale, which requires a complete breakdown of the vortex, and establishment of a polar anti-vortex.
2009 was a beautiful example. here are some graphics of that date, and we can see the strong easterly flow being present along the 60N line. -
4
-
-
- Popular Post
- Popular Post
An impressive FI warming on the 18z for sure.
This is what it would look like on the polar cap graph if it verified.
Actually, it would go perhaps at max to -30 to -25°. Not sure how its averaged. But it surely doesn't go to the max. temp you see on the charts.
As far as the zonal wind goes, and the easterly reversal and so on. Allow me to give you a quick crash course (again ) in stratospheric winds.
First let me just drop the GEFS 00z trend for the zonal mean zonal winds, which is encouraging for now.
Next, let me drop the same parameter, just from the last 3 GFS runs, since there was some talk about reversals. Well, GFS is not there yet.
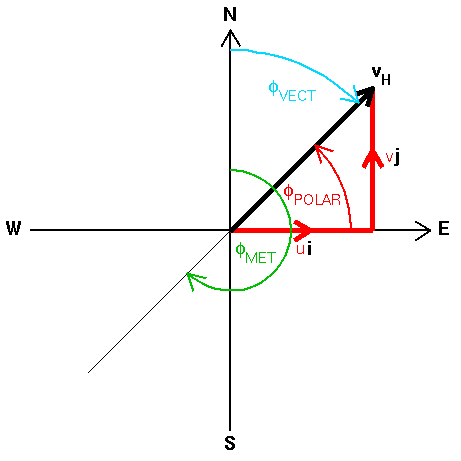
now, when we talk about zonal winds and reversals and so on, what exactly is it all about? I know it must sound confusing. First lets define the wind. Each wind has components. An east-west (zonal) component and a north-south (meridional) component. What these components actually tell us, is how much or how fast the wind or actually the air has "moved" in what direction. For example, if we have a 10m/s west wind, that is 100% zonal wind. But if we have 10m/s of SW wind, that means that it moves 50% to the east and 50% to the north. And those are the zonal and meridional components.
here is a visual example of a SW wind. The vj is the meridional component, which tells us how much has the air moved to the north (or south, depending on the direction of the wind) and the ui is the well known zonal component, which tells us how far east (or west, depending on wind direction) has the air moved with the wind. The black arrow is the wind vector, which defines the speed and direction of the wind. In short we usually call zonal u, and meridional v components. Those are also the official definitions in model parameters.
Now as far as our strat goes, when we talk about the zonal mean zonal wind, we mean the average zonal component along a latitude line across the globe. The most used example for the strat is the 60N lat line at 10mb.
i made an example, from GFS, the 10mb wind speed, with wind vectors. I have marked in circle, the 60N lat line. And around that line is where we usually average the zonal components. here we can see that there is a lot of north-south wind movement, or winds with strong meridional components. And that automatically reduces the zonal wind speed, because there is not a lot of eastward movement along that line.A bit better example is if I change the perspective. We can see how the wind moves generally eastward, but with a lot of north-south movement, due to the wave1 pressure which bends the polar night jet. What is interesting, is that there is little to no westward movement, or zonal reversal as we call it. The main reason why the GFS largely reduces the zonal wind speed, is due to the increase in the meridional component. Or basically the wind blows more in the north-south than west to east as in a perfect zonal example.
And an example from GFS, how an almost perfect zonal flow looks like. We can also see this increase on the ECMWF zonal mean zonal wind plots. That plot basically does the same job as my graphic, with the exception, that my graphics shows you exactly where and how much zonal or meridional wind is there at a certain level at a certain point in time, while the ECMWF plot basically just averages all the zonal components from left to right on my graphics and shows you the average zonal component. I also added the same plot for GFS, which practically tells the same story, just now you actually might now how it looks in reality on the normal lat/lon charts.
Now if I plot only the west-east or the zonal component, this is how it looks. This tells us how much and where the air moves on a west-east or left to right line. The positive values indicate a westerly wind, while negative values mean an easterly wind. The meridional component then defines if a wind within a negative region is a NE'ly, or a SE'ly. The zonal components define the W and E in the name, and the meridional components define the N or S in the name of the wind. Here we can see that there is basically no zonal reversal going on,Now when we talk about the zonal reversal at 10mb 60N, we do not mean an actual wind blowing in a straight line from east to west, but just simply the majority of the zonal components being reversed, so the wind is NE instead of NW, or SE instead of SW along the 60N line. We basically average (zonaly from left to right) all the zonal components, to see which one is the dominant one. Now the point of this reversal is not in the very wind itself, like the usual "we need that -1 m/s average zonal component, or else there is no SSW and no effect"...
There is hardly any difference between a +1m/s average zonal component or a -1m/s average zonal component. except for the purposes of classification and so on...
The very point of this reversal is somewhere else, and that is in the fact that as we see how dominant the zonal winds can be in the stratosphere, at that notorious 10mb 60N line (which above indicates a strong vortex), we know that it takes a whole deal of energy, both potential, thermal and kinetic and effort to actually reduce and reverse those zonal components. So the very deal is more as this zonal components being an indicator of the strength of the polar vortex or the polar anti-vortex, or wave activity, or the stratospheric polar high, and so on. When we see the reversed zonal components, where there was +50m/s a few days prior, you know you have a strong and intense process happening in the stratosphere, which can potentially affect the troposphere. So thats why at least to me, its not about the wind if its +2 or -4 or so on, but how fast and how much does the zonal component change, which i use as an indicator of the strength of the processes happening.
We also must note, that sometimes when we have strong wave activity, more likely in a wave 2 scenario, the zonal winds can actually increase due to the increasd pressure gradients as the two highs press against the vortex, which by default fights back, and we can sometimes see the vortex actually intensify with a wave 2 activity, especially if the wave 2 is shorter-lived and can leave a stronger vortex behind. So not all wave activity is always good. generally speaking. but as a rule, just remember that the more wave flux you have, the better.
As for the downwelling itself, which in this case is not mentioned very often, but that is normal since there is nothing in reliable time frames to talk about. We have to take the connection of the trop-strat into consideration here. is it coupled, is it decoupled? Because if you get a downwelling SSW of a medium strength, which is the most common, in my personal view, it is better to have a coupled trop-strat (logically) preferably a positive AO. Why? because if you have a positive AO, the chances are the tropospheric and the stratospheric vortex are strongly coupled. And as the upper one goes to sleep, the chances are better for the lower one to get hit in a similar way by the "destruction wave". Think of it a as a "channel" connecting the strat and trop polar vortex.
Where in a situation where you have a decoupled trop-strat, with no clear definite connection between the strat and trop polar vortex, the upper vortex might fail, but it could not have as much effect on the trop vortex, since it already spins in its own regime, more than being dominated by the strat vortex like in a moderate to strong +AO situations. The effects of an SSW can still come, but might have unwanted effects on the general circulation patterns, basically causing warmer weather in UK and Europe instead of cold, and can sometimes even disrupt the cold patterns already in place. And that is not a coincidence, because if there was already a cold pattern in place, chances are good it was in a negative AO, and if an SSW happened and downwelled at that time into a decoupled system, it could disrupt the circulation and actually cause a shift in wave numbers and positions in the troposphere, enough to create a warm pattern out of a cold one. So there is a reason why sometimes (not that often but it can happen) SSWs can actually cause warm weather instead of cold. We also know that the effects of SSWs are not instant, but can vary from a few days to two weeks or more roughly. So each situation needs specific analysis.This is just some of my thinking, which is not necessarily the same as someone else's, but it could serve you as a guideline or as a basic explanation of why and how strat works the way it does.
best regards
-
32
-
GFS parallel going over the top again.
-
5
-
-
You two are confusing the upper and lower stratosphere (which is actually meant) with upper and lower SSW (just a misunderstanding) which does not even exist so to speak
-
1
-
-
here is a "super-sized" comparison between multiple GEFS runs, which I will later use to verify the GEFS in strat dynamics, to see if there is any bias going on.
We can see that the ens member 7 is the lowest at 144h, and eventually ends in an SSW. And on the other hand we have member 11, which is the highest at 144h, and eventually also in the end winds up as the highest. If we compare them, we can see how the ens 7 actually has a stronger wave2 hidden in the forecast already at 144h. both, compared to the member 11 and GFS.
But comparing ens 11 and GFS, we can see that the ens 11 also has a bit stronger wave2 and wave1 (if you look at heights), and it moves the vortex a bit less to the siberian, unlike the GFS which has a weaker wave2 and moves the vortex a nit more towards siberia.
-
3
-
-
Well, on 6z it looks good, but still no technical SSW.
-
2
-
-
Uncertainties beginning to emerge in the ensembles.
As far as JMA goes, it was actually me, who said a year or two ago, that JMA GSM has superior configuration for strat forecasting to the GFS.
And it has variable runs, which means that only 12z goes to 264h, others go to 192 and less.
-
6
-
-
Well, I actually have an issue with that, since the axis are not the same. But will try to get around it a different way.
EDIT: So here is Excel
P.S.
I would also plot GEM ENS, but am out of time. i would tho say that care must be taken when dealing with GEM ENS for the strat since it has a very low model top of only 10mb. Especially need to take care when doing possible coupling, since it can easily undershoot the intensity.
-
8
-
-
We will talk about trop implications when there will be time for it.
But one thing is certain, and that is that we could see some uncertainty and confusion in the models when doing the possible coupling. i will take the tropospheric FI with a big grain of salt.
GEFS is now going below 10m/s in the U-mean U-wind section, just like GFS. So we kinda have a unique look here at a super agreement between the operational and the ENS.
And in the flesh.
-
7
-
-
new day, new runs. Luckily, the trend is still here.
Edit:
have i heard someone say JMA?
-
9
-
-
Cheers. I just see the time where initialization is. its on 10th at 12z.
you can see that mine which is from today , also 12z run, is also going much lower than yesterday. edit:
The 12z GEFS sure has stepped up the game. lets hope the future ones do the same.
-
2
-
-
Hmm, not sure, since this seems to be the 12z from yesterday.
And here is the 65N mean, to compensate for Lorenzos 65N based graphics.
-
As Chhiono has said, GEFS is seeing the drop.
-
1
-
-
well, it kinda worked for me best, and its not that I want to or like to do it this way, but I have to do it this way.
I also tried to ask questions and trying to do what others do, but it got me nowhere. So I decided to take a whole different approach to things. In the meantime, 12z is rocking the strat away.
-
1
-
-
Thats a good question, but I am kinda personal on that one, since I follow the "code" that if I can do it, so can someone else. So if I managed to figure out a system that works, with a some effort, so can someone else, and I encourage people to do it on their own, like I had to, because in the end that is the way that enables you to do it effortlessly eventually. It might seem like I am being selfish, for not "giving away" my techniques right away, but I have put decent time and energy into it, not to mention the hardware
and this subject in general I believe deserves that. But yes, I also use java based tools.
-
5
-
-
all the graphics that have my name on it, are my own. i am making my own graphics for quite a while now.
Usually you can find it on my twitter.
-
4
-
-
indeed. When looking at layers tho, its better to look at ozone mixing ratios. Here you can nicely see the surf zone.
-
6
-
-
- Popular Post
- Popular Post
Here is my animation of the 00z GFS, showing the downard propagation of the warming in 3D, from 10mb downwards. Looks like a wave 1 displacement SSW beginning. but of course only in the models atm, in the FI. lets not forget that
There is good GEFS support for now. We also have the first SSW forecast, coming from ens member 8.
-
17
-
- Popular Post
- Popular Post
Thanks guys.
Since you were so kind, here is another 3D animation, from 12z GFS, showing the downward propagating warming on the GFS from 240-384h, tilting and weakening the temperature core of the polar vortex. You can see its hearth shrinking in this run.
-
10
-
- Popular Post
- Popular Post
Not really that surprising.
I made a video of the 6z run, showing the absolute vorticity, from 200mb up to 10mb. In the first top down view, you can really see all the activity going on at the feet of the polar vortex, especially the strong wave breaking over Asia-Siberia, and Euro-Atl sector which is quite likely the reason we are seeing this warming now in 12z. It really gives you a feeling where and how the energy is going up from the troposphere, directly from the bottom up, into the vortex surf zone. Its perhaps not as easy to comprehend it right away, but if you know what you are looking at, it gives you a very new perspective, mainly because I haven't made an animation yet, with such defined wave breaking.
-
24
-
2 hours ago, BrickFielder said:
The royal Society publishing document on the relationship between stratospheric structure and tropospheric blocking patterns is interesting. I would agree that it makes sense that tropospheric conditions would affect the lower stratosphere. Where conditions in both the stratosphere and troposphere are acting to raise or lower the tropopause then they are likely to affect each other. What I think is not really explained well in the report is the concept of decoupling between the stratosphere and the troposphere and the importance of the scale of disturbances. Lets look at two current charts. Firstly the 380K Potential Vorticity Chart which I think has some correlation to tropospheric conditions (Not exactly but could be used for an element of prediction). Here I assume (always dangerous) that tropospheric influence on the stratosphere has been taken into account in the modelling.
Secondly the 475K Potentail Vorticity Chart which correlates much better with the upper stratospheric vortex conditions rather than the lower stratosphere or troposphere.
Yet again, when dealing with the IPV fields, I do hope you are taking the relative height of these fields into consideration. 380K is around the 100mb level, and 475K is around the 60mb level. So b oth fields are bordering both the trop and strat, with the 475K being actually in the lower stratosphere.
-
2
-
-
I cant see where I even mentioned one? :) I am just saying that the seasonal peak of the vortex strength is coming into fruition, and after that there is no further intensification in sight on the current runs.
-
3
-
-
GEFS does end the last intensification period, with no further zonal intensification in sight.
-
3
-


Stratosphere Temperature Watch 2015/2016
in Spring Weather Discussion
Posted · Edited by Recretos
Thanks to @lorenzo, he just reminded me of the NASA GEOS5 model.
Looks cool, with the nice seen region where the warming is charging from (the positive vertical velocity). We can also see some of the gravity waves.
and regarding the u-wind, its is close to ECM. And also by the wave 1 strength.
height wise, its going for a strong wave 1.