


Snowy Hibbo
-
Posts
136 -
Joined
-
Last visited
Content Type
Forums
Blogs
Gallery
Events
Learn About Weather and Meteorology
Community guides
Posts posted by Snowy Hibbo
-
-
19 minutes ago, Raythan said:
Could the record breaking MJO ( in phase 7 ) amplification be in any way linked to this *possible* SSW ? And if so could the *possible* SSW then have an impact on the further phases of the MJO mainly 8-1 ... long way of saying can they both be linked to each and correlate ?
Yes, Phases 6-7 tend to be the best for SSWs, so part of the forecast SSW involves that. I don't believe it will have much of an effect on the MJO weakening into P8 however.
-
 1
1
-
 2
2
-
-
I know these have already been posted, but bigger picture EC46
Day 20-25

Day 25-30
Day 30-35
Day 35-40
Day 40-45
Full NAO forecast from the EC46.
-
2
-
1
-
-
12 hours ago, Summerstorm said:
Hi Guys thought I'd post after lurking around and reading the posts must say I've learnt a lot reading through the thread so hat's off to @Bring Back1962-63 for creating this.
So I'll ask some questions now to help my understanding of some of the teleconnections if someone could me with them.
So my take is with the MJO progressing through Phases 6 and 7 that this should be beneficial in regards to HLB, however the low AAM means that we may not reap the benefits if I'm reading what has been said right? And the GWO is related back to the AAM with Phases 1/2/3 at low AAM and 4/5/6 with high AAM. I presume we need a rise in AAM before we see more blocking? There is a few more questions I want to ask but I don't want to clutter up this thread too much.
That's all correct. The MJO is good for HLB, and we need a rise in AAM for more blocking. That is a very simple way of putting it though, there's probably a way more complex answer for that. Ask away, this thread needs more questions....
-
1
-
-
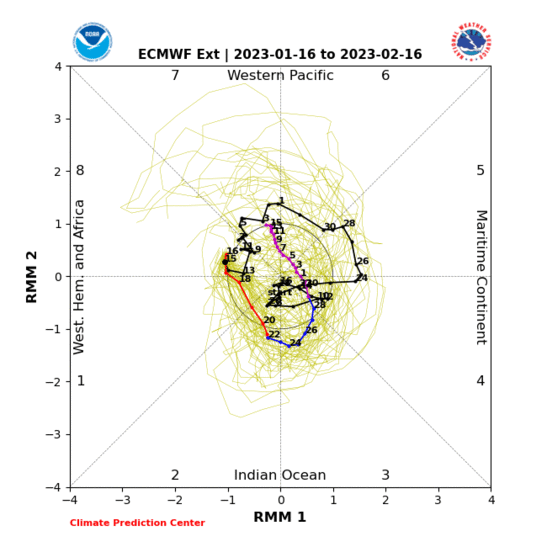
@nad, for your information here are the MJO verifications for NWP, predicting amplitude.
As you can see, ECM and UKMO have pretty good forecasting skill for the MJO. The RMM sometimes doesn't represent the MJO signal very well, so VP200 can be better for that. Or Hovmollers.
I always like these plots, because there are so many forecasts to compare.
Most of the NWP models show decent amplitude into Phase 7.
was meant to post this just after I finished it, but took me 16 hours to hit post.
-
1
-
-
24 minutes ago, Daniel* said:
I don’t truly understand these AAM plots but encouraging? With higher AAM moving away from v low AAM state forecast from GEFS 00z ens mean it is low amplitude though in COD? A push in amplitude and we’d be laughing.
Yes, it's very encouraging. Would be better if we had a little more Phase 4 and a little less GEFS craziness, but it's definitely encouraging.
-
4
-
-
7 hours ago, Gael_Force said:
That seems a bit harsh considering he is just commenting on what the latest ECM monthly shows. Surely the model will have 'considered' Nina base state parameters when the algorithms churned out the forecast?
Not really, I would be expecting more from a 'professional', than to just look at one model, that doesn't exactly have a massive reputation. It shows a bit of the Niña base state enacting upon the MJO, but not really. It might be a pitfall of EC, or an exxageration by RMM, etc.
7 hours ago, Thunderywintrysnow said:Not nice calling a professional paid meteorologist a joke just because your teleconnections says otherwise they have been wrong before and will be wrong again that's the same man who predicted the eastern USA big freeze over a month before it happened nobody is right or wrong until Feb is over play nice.
I know people who actually predicted that freeze, unlike Bastardi. A couple of guys from NY area, plus Anthony Masiello. They know their stuff, and used the strat + GWO + MJO + other factors, to predict the big freeze. I know Bastardi knows what the GLAMM is, but he fell into the GEFS trap like so many before him.
There are varying standards of professional, just because someone holds a degree, doesn't mean they are better than an amateur. I have met amateurs that are so good at predicting long term patterns, they beat all, but the most elite professionals. And Bastardi is certainly not elite whatsoever.
-
2
-
-
- Popular Post
- Popular Post
22 hours ago, Cleeve Hill said:For those that follow joe bastardi on twitter, he is pretty bullish about a v cold feb somewhere in the N hemisphere. He’s talking about MJO groing into 8,1,2,3 during February. Also M Ventrice showing GEFS going strongly negative NAO into Feb, although ECM not supporting this.
What a joke, that Bastardi guy. There's no chance MJO is hitting Phase 8. Niña base state will block that. MJO Phase 2-3 is totally plausible, like it did for the current cycle. But Bastardi is just throwing around wild MJO and other sub seasonal predictions, that we has no proof for. One of the cons of twitter popularity.
GWO is sitting in Phase 3, not Phase 4 as the Schiraldi plots indicate. Again caution of -AAM bias from GEFS, but it shows an increase in AAM, but no proper GWO Phase 4 and all the coldie benefits that go with it.
I offer the alternative, which is a proper GWO Phase 4 to 8, which gives a Scandi high and northerlies a better chance than normal. But does the MJO and the Niña base state have what it takes to bring us to that height.
Frictional Torque is currently slightly positive, I suggest it will stay relatively neutral, perhaps to the negative side for the next while. Not quite sure about that, but we need the FT to play ball, if we want that GWO Phase 4. We need tropical FT from MJO Phase 6-7, to hit Niña Easterlies in the Central and Eastern Pacific. That moves onto positive mountain torque, that brings a GWO Phase 4 state into play. Sorry if I am explaining what Tamara, etc has said over and over again, but the mechanics of this are crucial, if this fails, no Phase 4 GWO.
EPS is playing ball with my MJO Phase 6-7 prog, but remember not to play too much upon the RMM correlations. RMM fails, VP200 is probably the best viewing method of the MJO.
GEFS VP200 Week 2 (MV) shows a weakening Phase 6-7, but still significant. This could still allow us to play with MJO and Niña = tropical +FT.
I am going to leave the last word to a model I (and the vast majority) don't put much faith in. But it plays doubt upon, my theory above, and favours the GEFS AAM prog.
A lack of Niña Easterlies would place doubt on a major tropical +FT Phase. I personally don't think a weakening of the Niña base state could happen, with the MJO prevailing. But it is important to explore all options of where we can go. The GFS Hovmoller shows the opposite, a weakening MJO, with Niña base state prevailing. Yet no tropical +FT to affect GWO/AAM.
Very important to look at all pathways, which IMO I think it has been lacking in these threads for a while. We need to see all we can see, not just narrow our focus to the data we want to see. That makes for poor model analysis.
-
14
-
1
-
38 minutes ago, Blessed Weather said:
Many thanks for the response SH. Could you re-do the link please - doesn't seem to work. Thks.
-
1
-
-
14 hours ago, Blessed Weather said:
A great post Catacol. Thank you. I've been digging around to find papers that will help my understanding of 'frictionals' and their impact on weather/climate and wondered whether you have any links to some you could share? Also, links to the best websites for obtaining the latest charts?
I copied extracts of a couple of papers so folk visiting this thread can quickly see if the contents are relevant/of interest to them. In the first paper https://www.sciencedirect.com/science/article/pii/S1674984716300301 I thought Section 1 contained a reasonably easy-to-understand description of the 3 variants:
The atmospheric torques can be dividing generally into mountain torque, friction torque, and gravity wave drag torque.
Mountain torque is a function of pressure and orography, which exerted the solid Earth through a difference in pressure across any raised Earth surface. The most significant mountain torque is locating in the mountains or mountain massifs regions. For example, if the pressure over the west slope of the mountain is stronger than that over the east side, it acts to push the Earth to rotate faster and slows the atmosphere rotation down, which imparting angular momentum from the atmosphere to the solid Earth.
The friction torque is the wind or oceanic current frictional force on the solid Earth surface, which will directly speed or slow down the rotation of solid Earth. If there is a net global eastward surface wind, the atmosphere wind friction force will speed the solid Earth's rotation up, transfer the atmospheric angular momentum to the solid Earth, and thus the atmosphere loses angular momentum.
The gravity wave drag torque is part of the mountain and friction torque that is too small to be resolved by present Global Circulation Models (GCMs), due to the nature of coarse resolution of climate models will not resolve the regional/local mountains and mountain-induced waves, and their contribution to the mountain torque.I thought this second paper http://www.csr.utexas.edu/eos/reports/95anual/page5.html further helped my understanding by giving some 'real' examples:
Angular momentum has been shown to be essentially in balance among the components of the Earth system, namely the mantle, the oceans, the atmosphere, and the core. .......... Understanding the causes for the changes in the angular momentum of the various components requires a knowledge of the mechanisms that effect its transfer across the component boundaries. ......During one weekly portion of the SEARCH'92 campaign, we were able to isolate the mechanism responsible for a rapid acceleration of the atmosphere: the passage of a high pressure center from the western to the eastern side of the South American Andes in July/August 1992. ...... During the northern hemisphere winter of 1994, another intensive campaign captured a similar event of atmospheric angular momentum transfer by mountain torques, although this time acting across the Rocky Mountains of North America.
QUESTION - When the atmosphere loses angular momentum can this equate to a less powerful jet-stream circulating and higher incidence of blocking?
QUESTION - Different topic, but in your post you covered the MJO currently moving through the Indian Ocean. I see there's a powerful Tropical Storm Berguitta currently moving across the Indian Ocean. Will this enhance the MJO impact (i.e. amplitude) or is it merely a consequence of the MJO?
Thanks in advance.
That first study looks pretty good, and shows a good overview of the two main types of torque, and a lesser torque as well.
This paper may be useful as well, talking about the different torques and their relationships.
And this chart shows the GWO circulation, and the background consequences/signals, that lead to a certain GWO phase.
This would be where the GFS GWO forecasts live, plus GWO correlations.
http://www.atmos.albany.edu/student/nschiral/gwo.html
Beware of the -AAM bias on those forecasts.
-
2
-
1
-
-
14 hours ago, Blessed Weather said:
QUESTION - When the atmosphere loses angular momentum can this equate to a less powerful jet-stream circulating and higher incidence of blocking?
QUESTION - Different topic, but in your post you covered the MJO currently moving through the Indian Ocean. I see there's a powerful Tropical Storm Berguitta currently moving across the Indian Ocean. Will this enhance the MJO impact (i.e. amplitude) or is it merely a consequence of the MJO?
1. Yes it can.
2. It (Berguitta) is a consequence of the MJO, plus various other factors.
-
1
-
-
On 14/01/2018 at 07:11, Singularity said:
I am off the impression that a SSW is dependent on AAM rising sufficiently in GWO phase 3 - something not yet depicted by GFS/GEFS, be that rightly or wrongly so.
Do you really believe GEFS on this, given its -AAM bias? I think a movement to GWO Phases 3&4 is certainly plausible, and could become more and more likely, as we move into February.
-
10 hours ago, Ed Stone said:
Oh dear - I'm lost again!
What, if it's not the Financial Times, is the FT?
Frictional Torque.
-
1
-
-
32 minutes ago, Catacol said:
So - frictionals look to have turned to an upwards movement (though a bit slower than expected if I'm honest) with graph now heading back up
Yeah the FT has been negative for a longer time than expected by most. But it makes sense, with the slowly moving MJO signal in the IO, which causes the -FT. But as you said, AAM should go to the positive side soon enough, it just might be slower than many expect.
EC Monthly shows a nice movement of the MJO, however it is slow, and the best phases, which are 6 & 7, don't come until Mid February.
POAMA shows a similar timeline. So the MJO progression will be slow, which could allow for maximum tropical +FT to bring a knock on effect on Worldwide MT, and therefore affect the jetstream.
-
3
-
-
We are moving into Phase 2, so less of a decrease in Atmospheric Angular Momentum.
GFS shows a stagnation in the Global Wind Oscillation, in a deep -AAM state. This is pretty typical of GFS, which shows a -AAM bias. You can sometimes note the bias on the GFS jetstream maps, with weird jet splits and movement. IMO I think the GWO is going to start heading towards Phase 3/4, in a +AAM trend, due to an increase in FT, which will be occurred by the movement of the MJO signal into the Pacific. MT is already trending positively, so that should be helping a increase in AAM in the short-medium term.
The DJF GWO correlations are here for everyone's information and use.
Link for more months and seasons: http://www.atmos.albany.edu/student/nschiral/comp.html
-
2
-
-
Good start @Bring Back1962-63
The GWO is currently deep in Phase 1, and has been lowering in AAM for about a week or so now. This has gone way out of cycle, perhaps for several reasons. Firstly the MJO has been stalling in Phase 2 for a while, allowing FT to go quite deep into the negatives.
The FT is continuing to go further negative. However eventually when the MJO finally gets to Phase 4/5/6, it will start to interact with the Niña base state in the Pacific, and start to create a +FT in the tropics. This will stop the current decline in the AAM, and allow normal progression through the GWO Phases, up to the more favourable Phase 4 later in the month, or alternatively early next month,
On the Mountain Torque side, we see a fairly neutral worldwide Mountain Torque, largely due to the balance of a +Rockies MT (that recently declined) and a -EAMT. However an increase in Mountain Torque over the Andes, has increased the Worldwide MT a fair bit, and could have some effect on the AAM.
There's a bit of uncertainty with the MJO progressing through to Phase 7/8.... GFS shows a nice progression, EC doesn't,
This from POAMA, shows pretty much the track we want the MJO to progress through. In an ideal world, you might have the MJO a little stronger through Phase 4&5, for the AAM progression, but it should be okay. It shows us moving into the ideal phases in Mid February (thanks again to the current stalling). I can't guarantee against more slowing down of the MJO, with more stalling, so we will need to watch that progress obviously.
-
3
-
1
-
-
29 minutes ago, grca said:
Maybe Catacol, GP or Tamara might know the real answer here, could be faulty data? But where has the AAM reading gone to on this latest plot over night?
We are certainly in a -AAM environment, potentially could be off the charts kind of -AAM. Certainly plausible, if it verifies on WDT and tomorrow's GFS analysis, for a deep -AAM Phase. But until we get that data, I am holding my horses before making that assumption.
-
1
-
-
- Popular Post
- Popular Post
19 hours ago, Bring Back1962-63 said:Given the timing of the 30 to 45 day full cycle, we should reach the important stages of 7, 8 and 1 later this month. Providing the MJO doesn’t die again, then that should substantially assist with establishing HLB patterns. Ideally (for coldies), we would like to see the MJO remain in those key phases for as long as possible at decent amplitude
I am not too sure, if a Phase 8/1 MJO signal is possible. You might notice that the last two MJO cycles have shown a significant weakening around Phase 8. That is because of the underlying Niña state. The Niña Easterlies will compete with the MJO westerlies. The Niño regions are within Phase 7/8, so that is where the strongest Niña Easterlies are. The MJO signal will be beaten by the Niña Easterlies, which is shown in the data. So a prolonged Phase 7/8/1 event is probably not going to happen IMO anyway.
But this has an effect on the AAM. And after some helpful PMs and subsequent reading of studies and other online material, I have come up with this forecast.
Currently we have a -MT and -FT phase. When the MJO (Westerlies) comes into interaction with the Niña Easterlies, it will cause positive frictional torque. +FT moves the GWO to Phase 3/4. The torque propragtes into the mid latitudes, and helps a +MT pattern to develop. This causes a proper GWO Phase 4, at the height of the MJO Phase 6/7. When the MJO signal weakens at the hands of Niña, the +FT will be lost, and the GWO will start to move towards Phases 8/1. Then the MT will go negative a few days after, and then the GWO Phase 1 takes hold.
The MJO is linked to the AAM in this instance. Monthly models such as the EC Monthly and POAMA, show the MJO moving towards Phases 6/7 later this month, so this will be when these events occur. In the meantime, the negative AAM tendency will continue, and maybe the AAM will follow GEFS for once. Just think about that!
Anyway.... the MJO moves through IO, and towards Maritime Continent. You guys in England get single digit temperatures and even freezing temperatures, and we get 41 degrees here in Melbourne. Perhaps
-
12
-
2
-
26 minutes ago, Snowy Hibbo said:
Happy New Year from here in Australia (now in 2018).
AAM currently negative and stuck in Phase 2.
FT currently negative.
Worldwide MT driven by a +Rockies MT into positive values, but EAMT moving negative.
Interesting times momentum wise....
I meant Weak Phase 2, because it is in the weak circle, so it really isn't in a phase. Just highlighting the -AAM.
-
- Popular Post
- Popular Post
Happy New Year from here in Australia (now in 2018).
AAM currently negative and stuck in Phase 2.
FT currently negative.
Worldwide MT driven by a +Rockies MT into positive values, but EAMT moving negative.
Interesting times momentum wise....
-
11
-
5 hours ago, Singularity said:
Great post, thanks for your input
It is fascinating to watch the observed GLAAM continue to stall when every new GEFS update wants to send it downward. Attached is an overlaid image of the latest GEFS mean (bright colours) on that of 20th Dec.
The longer this goes on, the more we will see the proposed increase in westerly momentum to overrun any fledgling Scandinavian Highs being reduced. Should GLAAM start rising as you predict instead, that'll cause even greater modifications and also increase the potential for a more sustained blocking event. At this time, I can't say for sure whether that'll happen or not, but I sure hope your outlook bears fruit! Coupled with more appetite for a mid-month phase 3 MJO from the models today... well, its been a decent one for trends
.
The way ECM has been behaving over the past few days, I suspect a similar GLAAM error and subsequent correction has been taking place to that of GFS/GEFS, though probably not to such a large extent.
It's shocking that GEFS continues to be allowed to take GLAAM so far from realistic scenarios during the second week of any given model run; the extent to which this distorts the weather patterns means a significant amount of forecasting value is being thrown to the wind
.
Yeah GEFS is so annoying with the -AAM bias. I wonder if someone could get their hands on the EPS version, that would very helpful. Perhaps FV3 (the new GFS in development) could be ridded of that bias. Sometimes you can notice the GFS -AAM bias by looking at the jetstream charts. That just mucks up the outlook.
But I have come to the realisation(thanks to an interesting PM and a subsequent reading of a bunch of papers), that forecast probably was to optimistic, based upon the underlying Niña state. But will be interesting to watch the GWO move around, and hope the AAM works out in your favour. Will be interesting to see how the EAMT event on GFS progresses, and the MJO convection.
-
2
-
1
-
-
- Popular Post
- Popular Post
Musings about Momentum.....
Let's start from a place that I didn't realise I would ever start on. The GFS AAM plot.
Now everyone who knows the slightest bit about this relatively new sect of the weather study, knows that GFS has a huge bias towards a negative AAM. You can see the GFS showing it's usual movement into GWO Phase 1/2, to an unrealistic position, given the GWO cycle. What is important on this chart, and my starting point is the current observations. The blue line shows a relative stagnation of the GWO cycle, even slightly backwards. This movement is because the AAM has been stable over the past while.
Why?
Worldwide Mountain Torque decreased suddenly, driven mainly by a -EAMT event. I am still completely puzzled by this, because the GFS analysis looked a lot like a +EAMT. Perhaps I am looking at the wrong angle? Anyway it made it's impact, by stopping the GWO making it's continued orbit around. Now the MT is going back into the positives.
Most of mid-December featured a -FT, and recently the FT went positive. But now the trend is going negative, providing contrast to the positive trending Mountain Torque. In general, the two torques are mostly in seperate phases, except in certain occasions. Usually the MT follows the FT around, from what I have read. However the Mountain Torque is the major torque, so it drives the AAM and the FT weakens the peaking.
Anyway, what is the forecast?
Well the FT is hard to tell, but the MT can be seen.
The most important MT is in East Asia. You can see the descending Siberian anticyclone comes down in 2-3 days time, and sticks around to form a +EAMT, between a low and high.
Then you can see the result, which is increasing momentum and the beginnings of a NP jet extension.
Note the strong jetstream coming out on Manchuria and Japan. That is a +EAMT consequence.
And then a full jet extension, that provides effect until the end of the GFS run. The details of this synoptic pattern are to be sorted out closer in, but GFS hints at another wave break, caused by the extension, that pushes a -EPO/Alaskan ridge, which is causing this current pattern. So if that happen, more favourability for the Eastern US into Mid-Late January. But the +EAMT could (perhaps more likely) also fully extend the jet into the West Coast, so they can get more precipitation. The MJO doesn't really link up very well in Mid Jan, but could provide an AR oppurtunity in Late Jan.
So my final visualisation?
Here is my 29th Dec GWO forecast.
My forecast is the yellow line, following the annotations of my opinion. I have had to make various assumptions, and parts of this forecast will go wrong. But I have faith in the trend, and hopefully that will be the way it takes us.
GWO composites are available here, if you want to know what this means for the Eastern US region:
http://www.atmos.albany.edu/student/nschiral/comp.html
Thanks all.
Snowy
-
16
-
3
-
EC46 500mb
Week 1 (2-8 Jan)
Week 2 (9-15 Jan)
Week 3 (16-22 Jan)
Week 4 (23-29 Jan)
If you like a mostly neutral AO profile, and a positive NAO profile from Week 2-4... then you are all set.
-
3
-
-
2 hours ago, Catacol said:
Most striking today is the sharp return to neutral of mountain torque.... it will be interesting to see how much further this may climb into positive territory
I reckon it might climb up a lot....
It all follows this (blunt) chart I made a few days before Christmas. The Phase 1/2 event is currently running longer than I expected, but the GWO will eventually get back on cycle. I might have to adjust the dates though.
The yellow line is my forecast for the GWO.
I will update it tomorrow I think....
Any live shots of the Frictional Torque? WDT haven't fixed the AAM Plots for me yet.
-
1
-
-
These are some of my thoughts on European Long Range weather, from my blog about Long Range snowfall. I talk about MJO, GWO and the Stratosphere, and potential effects on the teleconnections that matter to Europe and the UK.
The MJO is forecast to have a Phase 2/3 event in the early stages of January on EPS. EC Monthly(below)shows a similar progression, with the cycle continuing to the more favourable phases of 6/7 (for a Sudden Stratospheric Warming event). Phase 3 + 10 days correlates with a +NAO.
GEFS shows a +NAO for the first few days of January, before moving back down to neutral into Mid January. CFS shows a +NAO pattern for all of January and February. That would certainly help the Northern Alps.
The Global Wind Oscillation is currently in Phase 1(below) and has been stalling there for the past week there. I predict that it will move towards Phase 4 in Early January, and reduce the current -AAM. A -AAM is often associated with a -AO type of pattern. However it looks like during Mid January, we could start to see a more +AAM, which would be more +AO like.
EC is showing another disturbance(below) to the stratospheric polar vortex in Early January. This could correlate with a -AO or -NAO, but the vortex isn't warming very much. The disturbance isn't disturbing the vortex enough to form a proper -AO pattern, but it might affect the AAM.
-
4
-


 .
.


Model output discussion - proper cold spell inbound?
in Forecast Model Discussion
Posted
Just following on from Tamara's great post above.....
Frictional Torque is currently going into a negative trend. After a FT peak, then followed the current MT peak, that has sent the AAM to it's current position. Below is my thoughts, based on my observations and forecasts of the key drivers. The FT will continue to decline into the negatives, and bring the AAM into a negative trend, towards a GWO Phase 7 & 8. But the question is will the MT make a full decline as well? Yes, you could try and use NWP to try and work out whether the EAMT will take a dive, or what will the Rockies MT do? These are the questions that need to be asked.
I am referring to the massive +EAMT, and the currently -RMT. Despite the sudden MT dive in the Rockies, the EAMT has been driving the Worldwide MT to levels that are quite literally off the charts. It is this, that has caused this AAM progression, that nobody forecasted and seems to defy the Niña base state. Whether this is an indicator of Niña weakening, or just a minor hiccup, isn't my question to answer, but many experts have been questioning the dominance of a Niña base state.
Anyway, this is my 'forecast'(yellow line), with annotations included. This assumes that the MT has a large negative trend, maybe it doesn't, and acts like a Niño GWO cycle. But I personally doubt this will happen, IMO that shouldn't happen so suddenly. It's one thing to have a +AAM, and another to have a Niño like GWO cycle. Anyway interesting times ahead, let's keep watch for the next steps of the AAM's progression.