


Kirkcaldy Weather
-
Posts
6,734 -
Joined
-
Last visited
-
Days Won
11
Content Type
Forums
Blogs
Gallery
Events
Learn About Weather and Meteorology
Community guides
Posts posted by Kirkcaldy Weather
-
-
23 minutes ago, booferking said:
Huge amount of Greenland highs on 18z would say 3/4 of the runs show some signal for it mean below for 276hr.

yes some great looking charts within the 18z GEFS
-
 4
4
-
-
- Popular Post
- Popular Post
certainly no worries or concerns regarding the strength on the block / high from me
12z pressure graphs
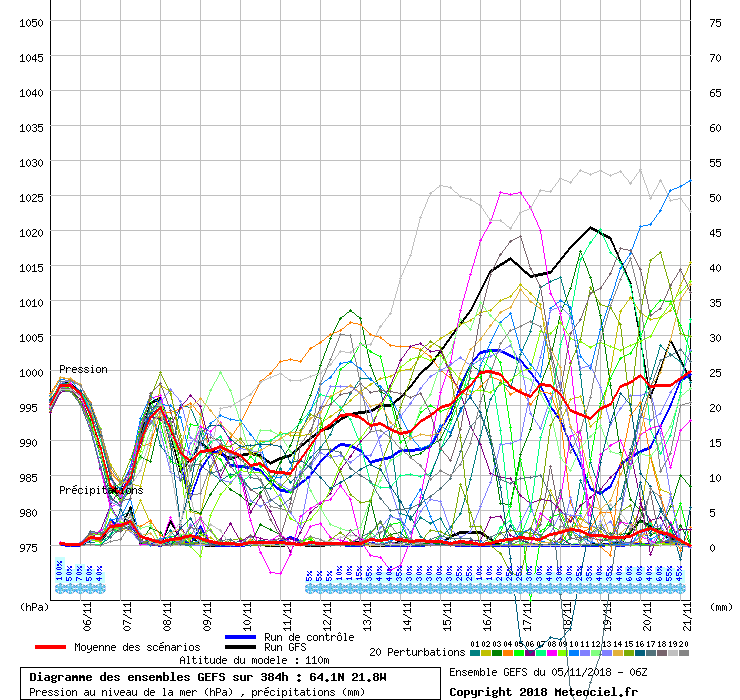
Kulusuk (east Greenland)
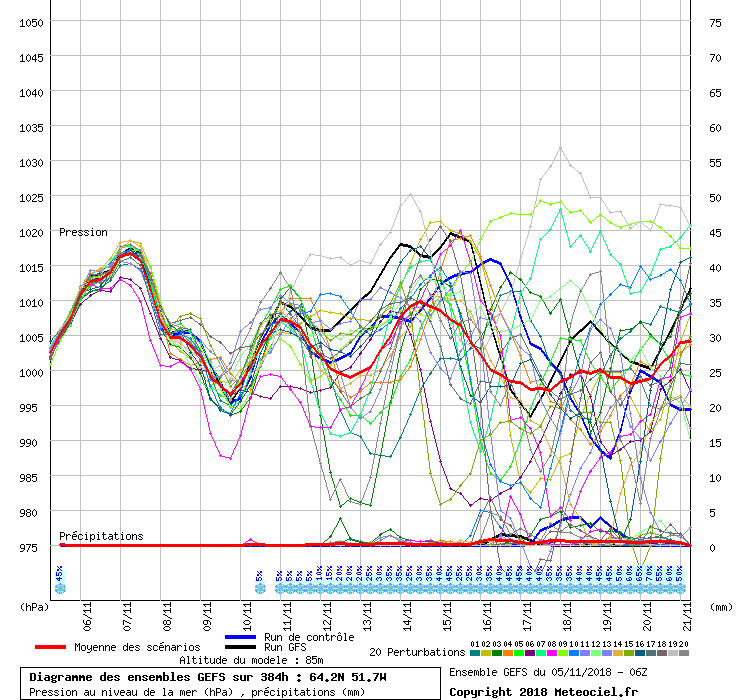
Nuuk (west Greenland)
Oslo
yes perhaps a slight dip but remember we are looking for the highest of the pressure to transfer from scandi > Iceland > Greenland
Reykjavik
Puppebu (Jan Mayen in arctic)
-
13
-
1 minute ago, bluearmy said:
gfsp nh view late on ……….
-
3
-
-
front tries to come in at the end of the run
....... BOOM almost countrywide snow some changes from run to run (as to be expected) but none are falling into the mild / zonal category. -
4
-
 1
1
-
-
18z GEFS
P2
P3
P5
P6
P13
P16
-
6
-
-
I had been looking at Nuuk for the pressure charts in Greenland (west side of Greenland) but here is the 12z for Kulusuk on the eastern side of Greenland and there is an upwards trend after the 17th November
here is Nuuk - also a slight upward trend but more of a split, now here is Puppebu on the island of Jan Mayen in the arctic and also a trend for a rise in pressure
-
4
-
1
-
-
4 minutes ago, Ed Stone said:
Is that Kelly Brook I see cavorting naked just outside my window?
lets hope she gets to take more pictures of the snow this winter too ....
anyway back to the "weather" models, dont think there is any need for panic/concern over the latest ECM which still shows heights building into the arctic and a few slight changes in the position of the scandi high could see it going down the GFS 12z route
-
6
-
-
- Popular Post
- Popular Post
4 minutes ago, Iceaxecrampon said:
 hopefully this is the theme of winter 2018/2019
 12z GEFS
control
P4
P5
P12
P13
P14
P20
-
11
-
- Popular Post
- Popular Post
keep these coming please GFS
arctic full of blocking
new theme song for the GFS if these charts continue
-
16
-
-
P12
P15
P18
P19
P20
GEM 12z ensembles also looking good
and some from the latest runs of the infamous cfs
1 month version
9 month version
-
5
-
-
- Popular Post
- Popular Post
7 minutes ago, Steve Murr said:Jeez some crazy ensembles ! Things are about to get busy in here....
Yes Steve certainly looks like an interesting time coming up for us cold weather fans.
P2
P7
P8
P12
P13
P14
P17
Oslo pressure going almost off the chart
more members going for the pressure to rise in Reykjavik
still a split in Greenland
-
10
-
- Popular Post
- Popular Post
12z GEFS
P4
P7
P10
P12 (split PV )
P15 (split PV)
P17
P18
-
11
-
2
-
- Popular Post
- Popular Post
P3
P10
P18
P20
P10 GEM 12z
Oslo pressure on the rise
-
14
-
P4 from the GEFS legacy 00z run
25th November 2010
not saying it would get as cold as it did in 2010 but nice to see some of these charts in the ensembles rather than a raging Atlantic.
06z GEFS
P5
P7
some deep cold to the east on P13
P19
looks like possibly a dip in pressure after mid month in Greenland then a rise again
Reykjavik pressure chart starting to look interesting with a possible rise in pressure after mid month with a couple taking it above 1045 hpa
scandi high (Oslo) looking to gain strength with some also getting towards 1045 hpa
-
6
-
-
P15 the pick of the bunch (plenty more have the high nearby or trying to get in a better position for us to get the cold, certainly not a zonal outlook at the moment)
-
5
-
-
On 05/11/2018 at 14:18, Kirkcaldy Weather said:
I think the ups and downs will continue in the models this week with some runs going more unsettled and some keeping the high to the east stronger with more of a blocked pattern.
as I said on Monday the potential for more blocked patterns to be shown within the models this week.
GEFS
control run
P2
P4
P5
P6
P8
P9
P13
P15
-
3
-
-
18z GEFS
control run -
P4 -
P13
P20
-
1
-
1
-
-
15 minutes ago, Tim Bland said:
Looks like they see brief northerlies behind passing systems and they say “ snow will probably stay over high ground in the north.”
P12 shows this (yes its FI but still a possible outcome)
P14 is the kind of pattern I am keeping an eye on with the scandi high heading towards Greenland possibly giving us an easterly
PV very weak on P20
-
3
-
-
P19 has a nice pattern with the lows diving south
some interesting patterns in the GEM ensembles from the 0z run
P9 pick of the bunch
P8
just shows how much the models are struggling with the difference in the pressure forecast for Oslo
Friday
Today
Very difficult to say whether the pressure will go higher or lower in Reykjavik
Greenland pretty split too
I think the ups and downs will continue in the models this week with some runs going more unsettled and some keeping the high to the east stronger with more of a blocked pattern.
-
6
-
2
-
-
P10 from the GEM 0z wouldn't be an awful position to be in by day 7 with a slight shift of the scandi high and better position of that low to our west and that colder air to the east could head our way
think the quicker the cold can develop to our east the better.
-
1
-
-
here are GEFS at around 50hr intervals starting at around the 100hr mark - 300hr mark which is obviously well into FI
102h
all pretty much in agreement with the low just to our west
150h
plenty trying to get some kind of block in place
204h
seems to be lots of possibilities at this time frame but still the majority with the high to our east
252h
almost similar to the 102h chart with a low to our west and plenty showing the high to our east
300h
less agreement with some unsettled but some with the high to our east
GEM ensembles pretty similar
102h
150h
204h
300h
Could be a repeating pattern with the lows just to our west and the scandi high trying to move westwards with possible easterly's for us at times.
-
3
-
-
Looks like a slight rise in the scandi high going by the pressure graphs for Oslo
and a 50/50 whether pressure will rise towards Iceland going by the Reykjavik chart looks like a slight decline in the pressure over Greenland (chart is for Nuuk) although hard to tell after around the 11th / 12th November with a split -
4
-
-
- Popular Post
- Popular Post
27 minutes ago, johnholmes said:So 3 perterbations show this out of how many please?
control
P1
P2
P6
P7
P8
P9
P10
P11
P12
P13
P14
P15
P16
P17
P18
So that is the control run and 15 members out of the 20 showing either a weak easterly or some form of blocking either to our east / north east or north / north west at some point in the run
-
9
-
1


 yes perhaps a slight dip but remember we are looking for the highest of the pressure to transfer from scandi > Iceland > Greenland


 ....... BOOM almost countrywide snow
 some changes from run to run (as to be expected) but none are falling into the mild / zonal category.


 here is Nuuk -
  also a slight upward trend but more of a split, now here is Puppebu on the island of Jan Mayen in the arctic and also a trend for a rise in pressure


 hopefully this is the theme of winter 2018/2019


 not saying it would get as cold as it did in 2010 but nice to see some of these charts in the ensembles rather than a raging Atlantic.


 think the quicker the cold can develop to our east the better.
 all pretty much in agreement with the low just to our west
 plenty trying to get some kind of block in place
 seems to be lots of possibilities at this time frame but still the majority with the high to our east
 almost similar to the 102h chart with a low to our west and plenty showing the high to our east
 less agreement with some unsettled but some with the high to our east


 looks like a slight decline in the pressure over Greenland (chart is for Nuuk) although hard to tell after around the 11th / 12th November with a split


Model output discussion - The Hunt For Cold
in Forecast Model Discussion
Posted
taking the charts in roughly 50hr steps from around the 100hr mark
GEFS
102h - scandi high in place
150h - 204 h - period to watch for the high moving from scandi > Iceland > Greenland

252h - more of an unreliable time frame but still BLOCKED
300h + more options on the table so probably not worth focusing on too much
GEM ensembles (same as above)
102h
150h
204h
252h