


BornFromTheVoid
-
Posts
11,369 -
Joined
-
Last visited
-
Days Won
27
Content Type
Forums
Blogs
Gallery
Events
Learn About Weather and Meteorology
Community guides
Posts posted by BornFromTheVoid
-
-
Quick Gif for October with the 60 line denoted.
http://gifmaker.me/PlayFrameAnimation.php?folder=2013102207xXFZ1V7rMLGlDkBoNN2Pgl
Along with monitoring this and the OPI - October Pattern Index, certainly adds another dimension to watching the season unfold to determine how much truth is in the theory..
What are the two dates in the animation?
-
And the final long range model for October to update is the Beijing Climate Center
For temperatures its going above normal

For rainfall its going for average to below average
Judging by the warmth predicted over the tropical Pacific, that may also be going for a +ve ENSO/El Nino during the winter. That doesn't seem all that likely at the moment, and so a change in the state of ENSO could throw many LRFs completely off.
-
 2
2
-
-
With a min of 13.1C and maxima likely to be in the mid 17s, we'll likely see an increase to 13.2C on tomorrows update.
After that, the 06z GFS op run has the CET at
13.3C to the 23rd (14.0)
13.2C to the 24th (10.9)
13.2C to the 25th (13.8]
13.2C to the 26th (13.0)
13.1C to the 27th (10.9)
13.0C to the 28th (10.1)
12.8C to the 29th (7.8]
I'd say 12.2 to 13.2C before corrections at this stage, and then 11.7 to 13.1C after corrections.
-
2
-
-
This was always on the cards though. The rapid refreeze this year is still amazing, but we very quickly ran out of open ocean that could freeze easily at this time of year. The IJIS plot will most likely see the 2013 trace converge towards the recent years plots. But which side of the average line will it be come the halfway point?
I don't think running out of open ocean is the problem, especially when we're at 6th lowest on record and dropping further below average. We've still got another 7 million km2 or so until we reach the maximum, so there's plenty of ocean remaining to freeze, especially near the Bering strait and toward the Kara and Barents Seas and the Baffin sea.
I think we're now having to deal with warmer SSTs, so they'll have to release their heat before freezing, which is happening now with large surface air temperature anomalies forming.
-
3
-
-
The rate of increase for the IJIS sea ice extent has slowed to well below average in recent days, letting us fall an extra 100k behind the 2000s average in just 5 days, and down to 6th lowest on record.
We're still over 1 million km2 ahead of 2007, 2011 and 2012 though.
-
2
-
-
Seems that paper attributes it to the PDO, not ENSO.
I wonder if we'll see further cooling if the -ve PDO continues, or whether a small temporary drop is all we'll get?
-
Alaska appears to have warmed for a while but has cooled quite dramatically recently.
Since modern housing, roads etc are a 'new' thing there I think it uncertain this is something new and unprecedented.
I doubt trees are a new thing though. Doesn't change the fact that the permafrost is melting anyway.
-
Agreed,it should have a mention in the news for the public to view,but do the pro warming scientists and governments with their green taxes want the joe public to view them?.
if it wasn't for the "pro warming scientists", none of us would even know about it. The media will do whatever the media will do, which is usually getting things wrong!
-
4
-
-
Here's an update of the CFS graphs I posted this time last week. For an explanation on how the graphs were created, check this post.
The one change that has been made, is the 5 day average line has been changed to a 10 day average.
Anyway, here's how November is looking.
There's been a big change over the last week in what the 12z CFS is showing. The 10 day average has dipped below 0, which indicates that negative pressure anomalies to our north will be more likely than positive. Over the last 10 days, 5 of the 12z CFS runs have shown low pressure anomalies to our north, 3 have been neutral and 2 have shown high pressure anomalies. The previous 10 days were 1 negative, 1 neutral and 8 positive anomalies.
Here's what is being shown for December
The strength of the forecast positive pressure anomalies to our north have weakened, but have remained largely positive and more consistent than November. The 10 day average remains at the moderate blocking/+ve pressure anomaly category (+2).
Over the last 10 days, 1 run has shown negative anomalies, and the rest have shown positive anomalies to our north. In the 10 days previous to that, all 12z runs had shown positive anomalies.
Of all the months I'm checking, March has been by far the most consistent, with just 2 runs out of the last 35 showing negative pressure anomalies, the rest showing positive.
-
5
-
-
Update for the week to October 19thThe current 1 day extent is 7,854,910km2, while the 5 day mean is on 7,642,064km2The daily anomaly (compared to 79-11) is at -728,110km2, a decrease from -906,030km2 last week. The anomaly compared to the 07, 11 and 12 average has decreased from +1,685,133km2 to +1,587,177km2 this week. We're currently 7th lowest on record, compared to 10th lowest last week.The average daily increase over the last 7 days was +119.7k/day, compared to the long term average of +94.2k/day, and the average of the last 5 years of +129.6k/day.The average long term increase over the next week is +84.3k/day, with the average of the last 5 years being +128.4k/day.The increase so far this October is the 7th largest on record. The record the largest October gain in total, an average daily increase of 168k/day is required for the next 12 days.
-
Minimum today is 11.4C while maxima look like reaching the mid to high 16s, so an increase to 13.1C is likely on tomorrows update.
After that, the 06z GFS op run has the CET at
13.1C to the 21st (13.8]
13.2C to the 22nd (15.9)
13.3C to the 23rd (13.8]
13.2C to the 24th (11.2)
13.3C to the 25th (15.4)
13.3C to the 26th (13.0)
13.2C to the 27th (10.5)
At this stage, I think anything below 12C before corrections, and below 11.5C after corrections can be ruled out.
-
3
-
-
Below is the November CET, with the 10 year average in red and the linear trend in black.
The correlation between the October and November CET is the second lowest off all consecutive monthly pairs, at +0.235, and when the long term trend is removed from both months, the correlation is even lower +0.186. This is still statistically significant and suggests and warm Octobers are usually followed by warm Novembers and cold by cold, as would be expected, but that relationship is not as strong as most other months.
October looks like finishing somewhere between 11.8C and 12.8C, and the average November following those Octobers is 7.3C.
A record high November CET would be required to beat the highest 10 year mean, 7.7 in 2003, so that's very unlikely.
The current run with the 10 year mean above 7C, 15 years, is the longest on record, the previous record being 6 years, between 1982 and 1987.
The current run with the 10 year mean above 6C, 82 years, is the longest on record, the previous record being 22 years between 1888 and 1909
It's been 87 years since a November CET below 4C was recorded, back in 1925. The previous longest run was 34 years, between 1817 and 1850.
Just like October, a run of cold Novembers is well overdue.
-
6
-
-
Wow in need of course its not in the papers
-------------------
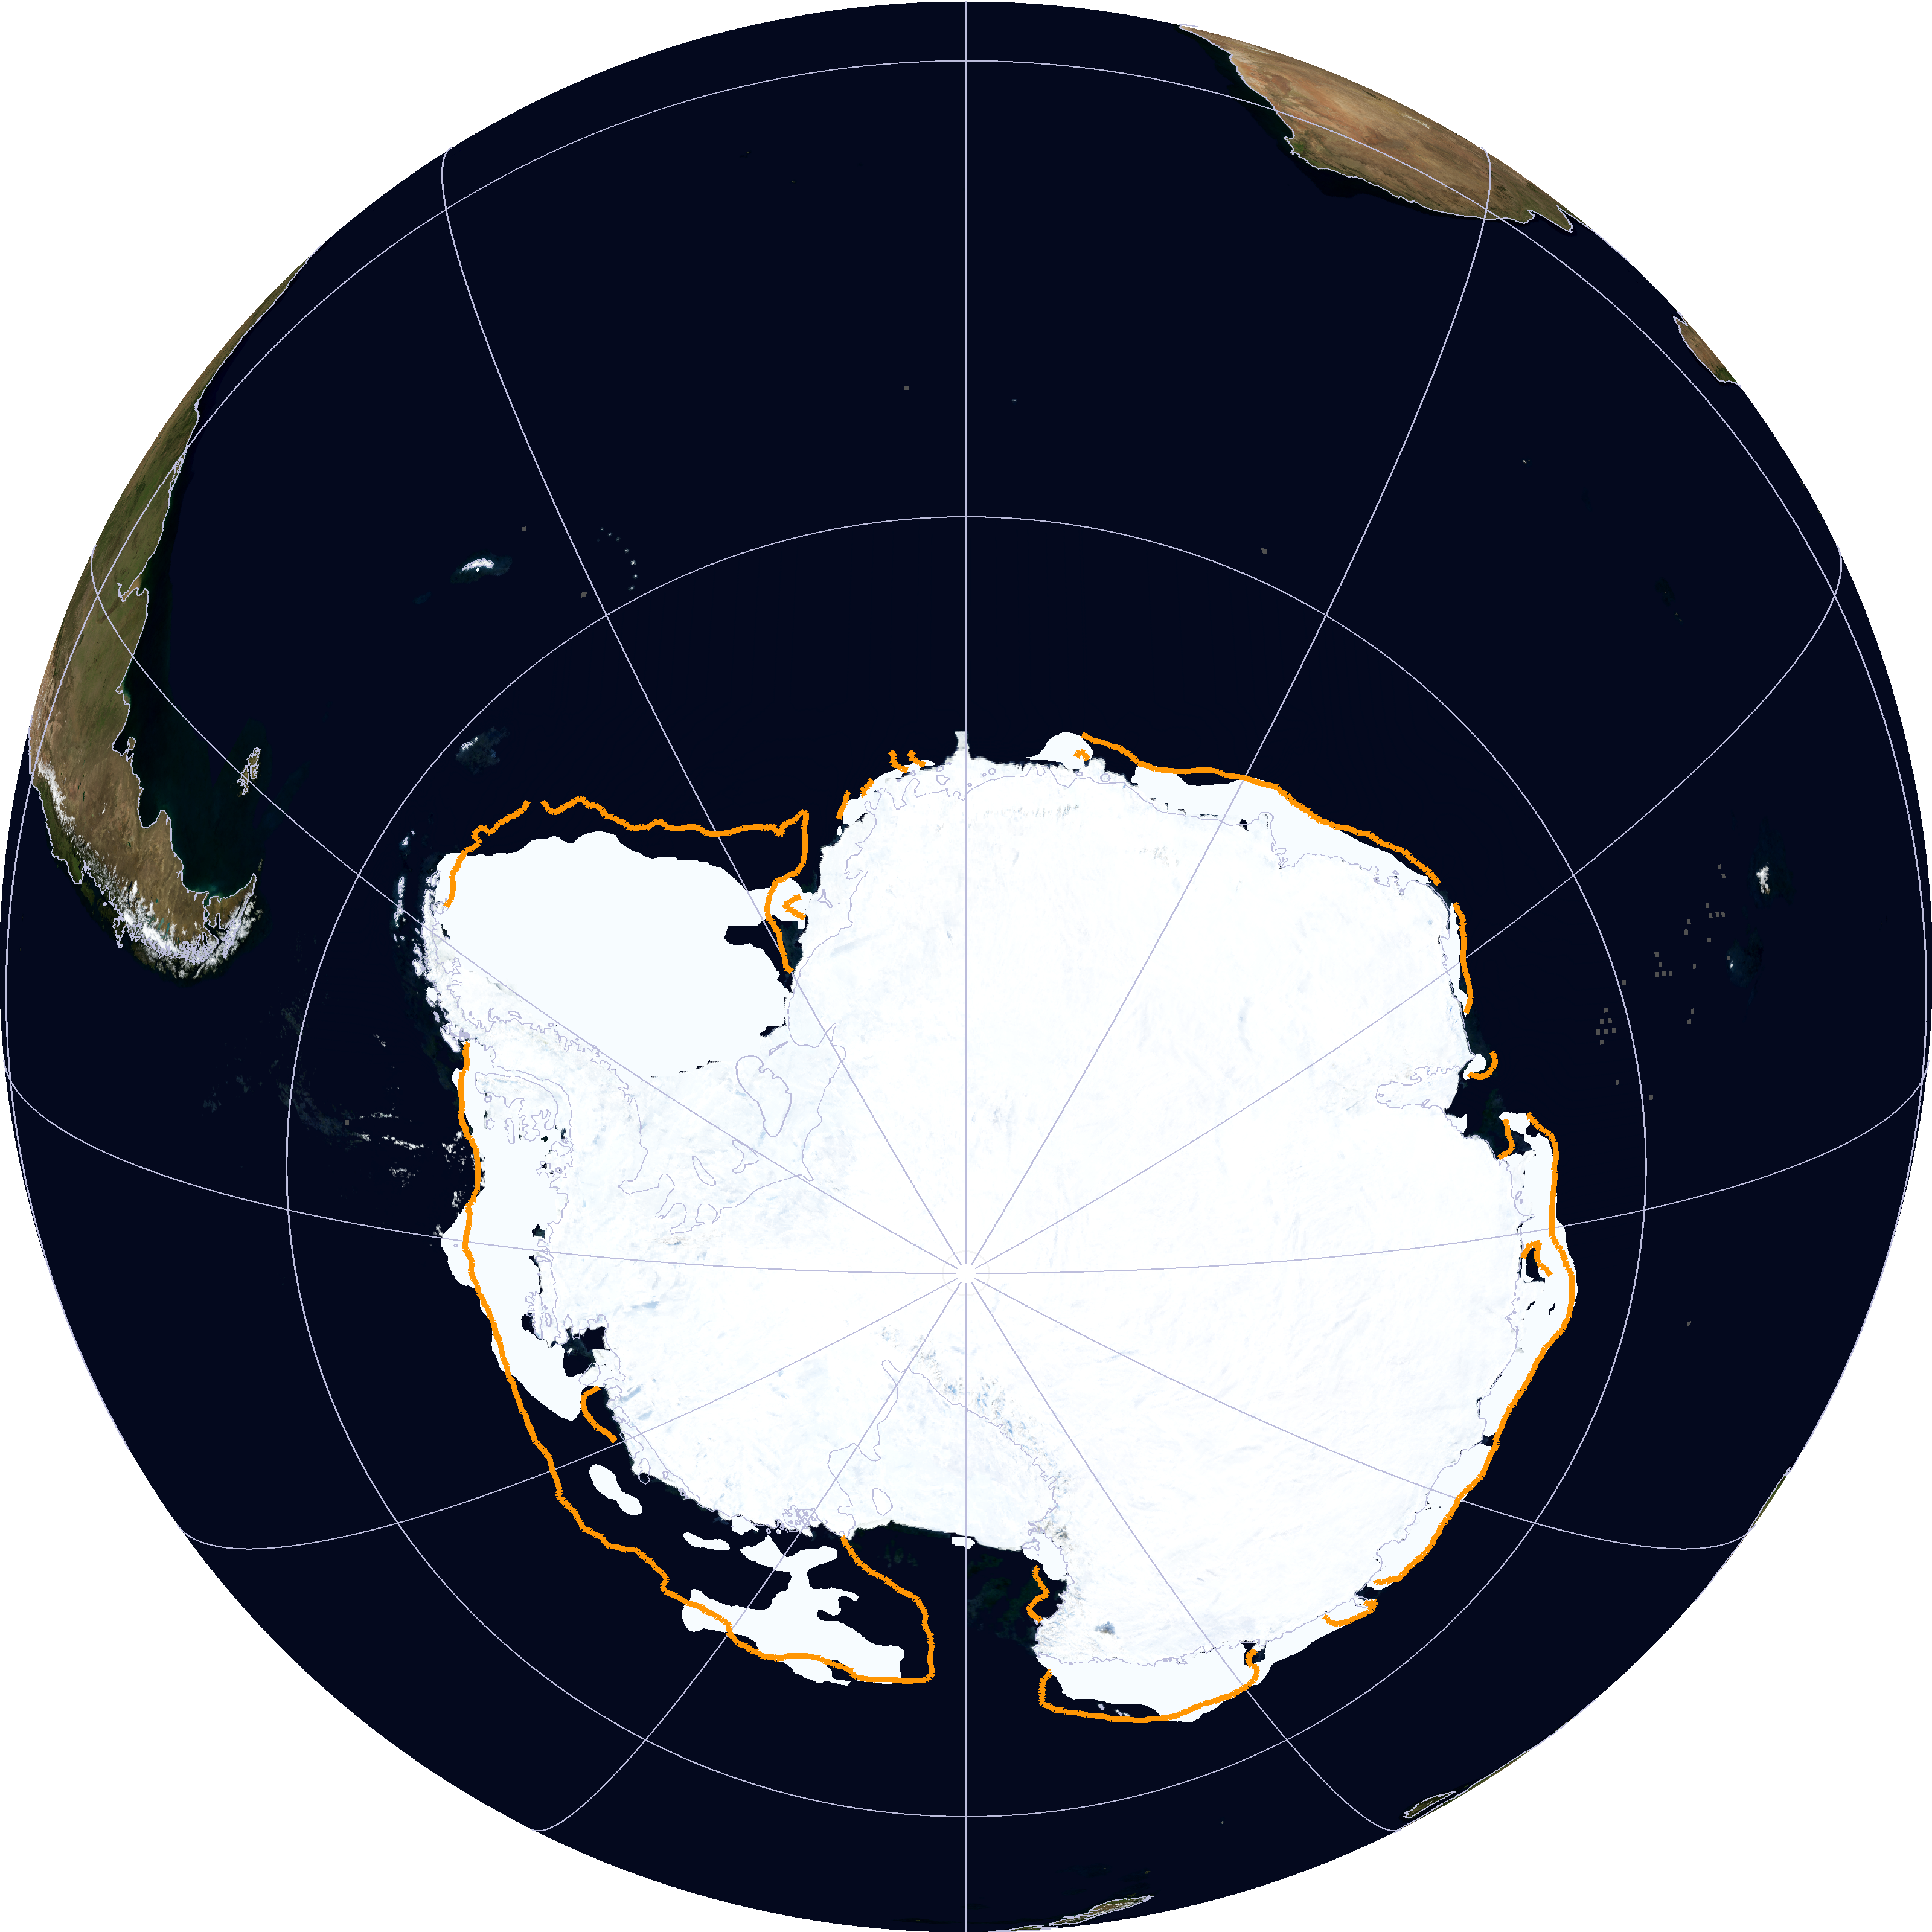
Antarctic sea ice is mostly located outside the Antarctic Circle (Figure 1) and should be the first to melt due to global warming theory. Yet Antarctic sea ice has been increasing and expanding towards the equator contradicting all the models.
=============
http://wattsupwiththat.com/2013/07/22/why-antarctic-sea-ice-is-the-better-climate-change-indicator/
http://nsidc.org/data/seaice_index/images/daily_images/S_stddev_timeseries.png
http://arctic.atmos.uiuc.edu/cryosphere/IMAGES/seaice.recent.antarctic.png
http://nsidc.org/data/seaice_index/images/daily_images/S_bm_extent_hires.png
Global sea ice above the long term average at the above.
While I agree that this should be getting more attention, that WUWT link really is a steaming pile. I hope you can see through that nonsense!
-
Might it be time to get the ramping thread going?
-
3
-
-
NAO implicated as a predictor of Northern Hemisphere mean temperature multidecadal variability
The twentieth century Northern Hemisphere mean surface temperature (NHT) is characterized by a multidecadal warming–cooling–warming pattern followed by a flat trend since about 2000 (recent warming hiatus). Here we demonstrate that the North Atlantic Oscillation (NAO) is implicated as a useful predictor of NHT multidecadal variability. Observational analysis shows that the NAO leads both the detrended NHT and oceanic Atlantic Multidecadal Oscillation (AMO) by 15–20 years. Theoretical analysis illuminates that the NAO precedes NHT multidecadal variability through its delayed effect on the AMO due to the large thermal inertia associated with slow oceanic processes. A NAO-based linear model is therefore established to predict the NHT, which gives an excellent hindcast for NHT in 1971–2011 with the recent flat trend well predicted. NHT in 2012–2027 is predicted to fall slightly over the next decades, due to the recent NAO weakening that temporarily offsets the anthropogenically induced warming.
A pretty interesting paper, predicting cooling for the NH up to 2027.
The full PDF is here http://onlinelibrary.wiley.com/doi/10.1002/2013GL057877/pdf
-
NSIDC chart updated, just "wow" http://nsidc.org/data/seaice_index/images/daily_images/S_stddev_timeseries.png
I think the CT graph illustrates the "wow" factor even more!
http://arctic.atmos.uiuc.edu/cryosphere/antarctic.sea.ice.interactive.html
-
5
-
-
NSIDC extent data is once again available.
Here's how we're doing in October so far
Here's the daily extent change (like the IJIS graph above)
-
2
-
-
No worries guys!
Between Oct 1st and today, I've record over 2.3 times the September total rainfall. So quite a switch-around (98.3mm so far, compared to 41.6mm for Sept).
More rain today and even a risk of storms, should help to cross the 100mm mark. With the forecast continuing very unsettled, I'll probably pass the 150mm mark during the next week. Could be wettest month since August 2012 for the south of the country.
-
Yesterday was 12.2C. Today's min is 12.1C, while maxima look like reaching around the mid 17s, so an increase to 13.0C is likely tomorrow.
13.1C to the 20th (14.8]
13.1C to the 21st (13.6)
13.3C to the 22nd (16.0)
13.4C to the 23rd (15.5)
13.3C to the 24th (12.9)
13.4C to the 25th (15.2)
13.4C to the 26th (14.0)
The record high daily mean temperatures for the next 7 days
20th: 14.9C
21st: 15.2C
22nd: 16.2C
23rd: 14.4C
24th: 14.3C
25th: 14.0C
26th: 14.7C
The 20th, 23rd and 25th look under threat.
-
2
-
-
- Popular Post
That all may well be so but anyone who reads a LRF from anyone thinking that it is much more than a roll of the dice is deluding themselves. I'm sure that he makes his forecatss honestly but that's no reason to give it the time of day.
I think it's fair to relate him to someone who is being so specific, he is quoting dates which is ludicrous. Record mild temps on Christmas day or raging blizzards on Christmas day, two different forecast but with the same motive....trying to get a reaction!!! I have learnt over the years not to get sucked in and emotional, especially at such an early stage in Autumn.Listen to the more informative folk on here ie chiono,Recretos,SK,Lorenzo, Interitis,Johnholmes,CC,to name but a few
This response is for both of ye.
The thing is, I disagree with RJS on many things, especially his forecasting methodology. Having a science background myself, I find it a little off putting to see someone go against the well established (perhaps proven) terrestrial, teleconnective relationships, but, I can appreciate the huge amount of honest effort he's put into his forecasts. Over the years of reading them, it seems apparent that he doesn't twist them in order to get a reaction. He's not trying to profiteer or garner media attention off his forecasts.
He's had threads on this forum with what looks like dozens of hours work put into explaining his methods and research. Even his calm and reasoned reaction to the attacks and criticism directed towards him here is impressive!
I can completely understand the aversion to long range forecaster predicting events on specific dates, but most of them (Madden, Ken Ring, etc) are in it for the media attention and money, which isn't the case with RJS. By all means, critique his methods, call him out when he gets things wrongs, ask (kindly!) for an explanation for something that seems outlandish, but in my eyes, it's completely unreasonable and insulting to box him in with the likes of Madden.
-
17
-
- Popular Post
I'm sure Madden works hard on them too, they are exactly the same if they try and claim some superior knowledge as to how things will be on a given day. If someone like that makes such crass pronouncements then they deserve to be bashed. Madden is crazed thinking he can, so it's only fair to say the same here.
RJS has gone to great lengths to explain his methodology on this forum and doesn't make up BS excuses if things go wrong. He clearly doesn't bias his forecasts towards cold in order to appease the masses, but remains honest and sticks with what the data and his methods show.
It's completely unfair to relate him to Madden.
-
12
-
Not a particularly promising sign for coldies with a mid Atlantic ridge (for sustained cold at least).
Well, to clarify, it's a mid-Atlantic/southern Greenland ridge (not quite a Greeny high). It has the potential to pull in some northerly flows anyway.
Here's a teaser of what December is looking like at the moment, though it may change very slightly when I do the full winter forecast next month
I think there's plenty of potential there anyway.
-
5
-
-
The running mean for 2002-12 in need the mean 2000-12 for the forth coming days suggests we may go through the 2000's averages in the next few days.
The cold remains locked up in the high artic
http://ocean.dmi.dk/arctic/meant80n.uk.php
I would hope we can start to see some gains on the west of the Artic (That gulf stream is shown in all its glory in the attached picture)
http://www7320.nrlssc.navy.mil/hycomARC/navo/arcticicennowcast.gif
At the growth rate of the last 5 days (120k/day), it will take another 11 days to pass the 2000s average. With a very high growth rate, say 150k/day, it would take 6 days.
Not sure the gulf stream is making it all the way to the Kara sea though. Perhaps is more the +ve AMO helping to keep the ice held back there?
-
2
-
-
No belfast has a record high of 14c so I thought it would be colder here. can't find data for here.
Although much more exposed, Malin Head has a December high of 16.8C. That can't be much more than 25 miles from you?
I'd guess your record high would be closer to 15C.


Snow and Ice in the Northern Hemisphere 2013/14
in Spring Weather Discussion
Posted
Cheers guys, just spotted the date hovering over the eastern Pacific!