


swilliam
-
Posts
498 -
Joined
-
Last visited
Content Type
Forums
Blogs
Gallery
Events
Learn About Weather and Meteorology
Community guides
Posts posted by swilliam
-
-
3 minutes ago, Daniel* said:
No idea of late but a general pattern for the models success is indentifable. ECM top dog of course, the canadian model GEM (the black line) ought to be wheeled out more often, greater success at day 5 than GFS in many occasions. On rare occasions the canadian model has outperformed the ECM at day 5, however when it goes wrong.. it can be the worst of the bunch. Sadly nothing of UKMO but I sense it will just be knocking second..
It says in the text UKMO was tied 4th (i.e behind theses three).
-
Very clear trend on De bilt ensembles. Steady cool down this week then a notable warm up for a few days. this is then followed by a steady decrease again - remarkable support for this at this range with only a few members going differently (including control).

-
ECM mean at 240 looks excellent - large negatively tilted ridge in the mid Atlantic. It is probably best to not keep reacting to every detail of the Op runs and talking about upgrades/downgrades etc. It looks like it will be blocked for the foreseeable future and the details past 4/5 days are currently unknown.
-
 5
5
-
-
Not a great set of ensembles compared to previous runs
London
somewhere in Scotland - Op definitely a cold outlier
- hopefully not a trend -
-
23 minutes ago, feb1991blizzard said:
was hoping for better tbh, want to see a decent number flatlining below -8c
It is not winter yet - or only just in the outer limits of the models. Expecting flatlines below -8c is fairly optimistic IMO - probably only happened once in 100 years (2010) and then for 3 days at the end of November and 3 days at the beginning of Dec (edit -and that came from ENE not N or NW like we have in prospect).
-
3
-
 1
1
-
-
15 minutes ago, winterof79 said:
Looking at the GEFS and the Atlantic high at 168Z ,the Control and quite a number of other perturbs have the high more robust and allowing nothing over the top
I have also included link for the 168 for the UKMO and if you click on the other models at D7 they too say no to a sinking high scenario as only GFS has the milder air coming over the top.
https://ruc.noaa.gov/hfip/tcgen/
It will automatically take you to D2 on GFS ,then you can navigate to D7 and see the differences
Yes looking at those even the mean is better than the Op and all the spread is around the size of the ridge.
-
1
-
-
17 minutes ago, bluearmy said:
with no low anomaly to our south the climatological 'average' will be too high to allow the pattern to advect cold to nw europe
High anomaly to the NW, low anomaly to the SW and E - looks pretty good to me for an anomaly chart.
-
22 minutes ago, Man With Beard said:
Perhaps 30-40% of this morning's ECM ensembles are of great interest to coldies by T162 - there's going to be a decent sized cluster of runs that clear low pressure through the channel with pressure rising to the north.
Yes you can see the split @ on the 21st
-
2
-
-
22 minutes ago, Ricepilot said:
Long time lurker here but the storm that just passed overhead rather made me sign up to share my experience...
Arriving home from work I caught a bit of mammatus cloud which I've never seen before so my hopes were high that I would see a storm local to me.
What a beast it turned out to be! I've seen many a continental Europe storm and even African storms but all never matched this storm. I've put myself into storms before but this was the first time I felt genuinely nervous. I've never seen such frequency of CG's dropping into the fields around me. I was unable to retrieve the camera from the roof of the car for about 20 minutes. After a four year drought of storms during darkness hours this was worth the wait.
I captured lightning on every single one of my photos as it was so frequent. I've uploaded a couple pics below, and a few more can be found here on this link https://flic.kr/s/aHskZJddAX
Later today I'll hope to have posted the video from the camera on the roof of the car but for now its bedtime!
Fantastic pictures - well done.
-
1
-
-
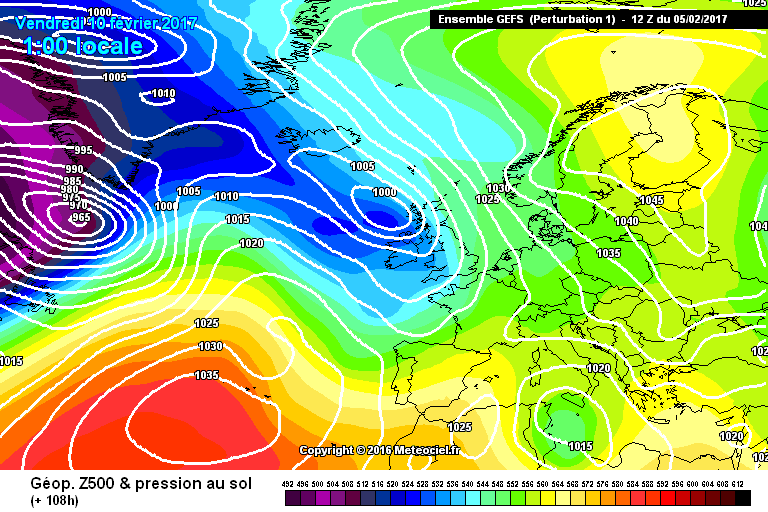
3 minutes ago, I remember Atlantic 252 said:
Similar to GEFS ENS 1, that's a horror
????? - It is nothing like it all.
-
2
-
-
21 minutes ago, booferking said:
Yep not many good runs in them quite a U-turn.
Not sure what people are expecting - I think the bar has been set way to high. This is the set for London
In FI mean of -2/3, most below 0, several below -5 and a couple below -10. Mean like this
virtually no Atlantic - what are you expecting or hoping for.
-
3
-
-
Jet not quite so strong on GFS at 198 so maybe won't just power over the top this time
12Z
06Z
-
2
-
-
1 minute ago, mulzy said:
And in English what does this mean? Or do we have to second guess?
It means it is different to the last run? So is the UKMO which has phased the two lows associated with the cold pool in Russia this time giving a different orientation to the block - no idea whether this is good or bad - let's see.
-
3 minutes ago, Connor Bailey Degnan said:
Ecm mean at 192 is very decent. Looks like op was a big outlier. Phew.
Right in the middle - but perhaps a bit slower 144- 192.
-
4
-
-
2 minutes ago, Doctor96 said:
swilliam
- 6 uppers is not good enough , that is cool not cold
Are you serious?
-
6 minutes ago, Ali1977 said:
I'm liking the look of the ENS at 150, a lot.
The mean charts at 180 look very good - -6 uppers on the east coast.
-
6
-
-
28 minutes ago, Backtrack said:
Coming from a realistic point of view- isn't it unlikely that our entire longitude position across the entire earth is affected by a cold outbreak? Below average in a ring around the earth. Chart seems unlikely, surely?
I think you are being swayed by the appearance of blue everywhere. If you look at the 850 anomalies you will see that there is roughly even spread of colder and warmer. It is just that warmer in say Siberia or N China (where I happen to be going to for 10 days) is still very cold in terms of 850s. In fact under the large HP there the 850s will not have much influence and at the surface there is very little difference (typical Max -15, Min -25 in Harbin where I am going).
-
1
-
-
7 minutes ago, feb1991blizzard said:
Right, it still isn't going to make a massive difference to us, it might be the difference between the wet / dry boundary but definitely not any deep cold coming on the back of that.
Well I believe SM thinks differently but I will let him explain that for himself.
-
1
-
-
5 minutes ago, feb1991blizzard said:
Already edited my post accordingly, not dissing him as he is highly qualified, but he is a bit of a maverick, not sure what he meant but no snow is happening in that timeframe I can tell you now.
He is talking about the big snowstorm on the US east coast that the UK model is predicting but the GFS is not - this is what SM is talking about as it has downstream consequences for us.
-
3
-
-
Huge spread on the dutch ensemble at D15 as expected ranging from -10C to + 7 (nothing that could be described as mild then). Mean about 2/3 C and a reasonable cold cluster as well so still all to play for IMO.
-
1
-
-
6 minutes ago, JOPRO said:
That ecm upgrade was a waste of money! Still no better at calling uk cold spells!!. To be fair to the UKMO plays it safe by only going out to 144hrs. Hence it seems to have a better handle on events in out little part of the world. GFS and ECM do themselves no favours going out as far as they do as how often does a 240hr or 384hr chart Verify?
The ECM 240 verifies about 40% of the time according to the official statistics. Can't remember the number for GFS but less than this. As for 384 probably about 0-1% but have seen any statistics.
-
2
-
-
Well the ECM ensemble mean is similar but slightly better than this morning. You could not say it directly supports the op with the mean ridge further E than the OP which must be one of the most favourable outcomes.
As expected a lot of variance round the S tip of Greenland
One of the colder options at D10 at De Bilt but not the coldest by any means - so probably still all to play with the OP being a possible if less likely outcome.
-
2
-
-
- Popular Post
- Popular Post
15 minutes ago, TEITS said:How do we know it has a negligible effect. If a butterfly flapping its wings can change the outcome then surely lack of data can do the same. Also do you know the exact amount of weather balloons launched on a normal day and how many on xmas day. If you cannot answer then you cannot say Xmas model output isn't affected.
This seems to me to be very easy to prove or not. There are detailed verification statistics for all the models at different timescales. If someone would care to go back through these over the years then if there was any influence of any change in the amount of data over Christmas then this would show up as highly correlated dip in model accuracy over 25/26/27 Dec. I am not going to do this as
- It is up to those who believe this to be true to show this - not for others to prove that there is no correlation
- I am sure the world weather organisations have already checked this and would have highlighted it if there was a dip in model accuracy over this period
-
12
-
7 minutes ago, vizzy2004 said:
Whilst not a complete outlier the GFS OP is one of the coldest runs at this time frame.
Yes not an outlier with 4 other members showing this - in fact P12 gives the best solution with a few days of cold.
Even with some troughs giving some inland snow - not just the wishbone effect
Chances are pretty low for this kind of solution but obviously possible - we can but hope.
-
4
-


.jpg.1dd1640f66fda579693571c8bb583e9d.jpg)
.jpg.ddd80da5ba723f2fbab96a4e7f23d49b.jpg)
.jpg.bfacd5b1ed463855f5a9c14a988de081.jpg)
.jpg.fff4a17e5552109bfda3851cef9baf5f.jpg)


Model Output Discussion 01/09/17
in Forecast Model Discussion
Posted
Terrible grammar in the tweet - one reason why I rarely read tweets