


summer blizzard
-
Posts
18,606 -
Joined
-
Last visited
-
Days Won
9
Content Type
Forums
Blogs
Gallery
Events
Learn About Weather and Meteorology
Community guides
Posts posted by summer blizzard
-
-
ASO ONI came in at +1.5.
To update our list and ranking.
Our updated list for ASO.
1957: +1.3
1972: +1.6
1976: +0.6
1986: +0.7
2002: +1.0
2009: +0.7
2014: +0.2
2018: +0.5
2023: +1.5
We remain second.
To update on our ENSO trades index, October strengthend to -0.8 as we finally saw the Indian Ocean shutdown with the end of the Monsoon.
https://www.cpc.ncep.noaa.gov/data/indices/cpac850
To compare to our primary analogue list since 1979 (standardised):
1986: -0.4
2002: -0.6
2009: -1.1
2014: -0.3
2018: -0.8
2023: -0.8
MEI did fall back but this was likely due to the weaker westerlies in September so the next update should bounce back.
Atmosphere continues to favour strongest forcing west of the dateline.

Sub-Surface as you would expect.
-
Tropical convection for the final third more supportive of moving into a more favourable area for heights to our north and east.
-
 5
5
-
 1
1
-
-
So it's not the exact one used by the Met Office previously but May-Sep Atlantic SST's apparently indicate a neutral NAO.
-
Do we know if it's likely an existing cone will erupt or in this situation does it just open a random fissure at the weakest point.
-
Credit via Twitter from (Glacier Point?) i think.
Basically shows that the Euro is forecasting a higher than average probability of SSW.
-
4
-
1
-
-
One imagines that the January chart would feature a more pronounced block somewhere north west in reality but it would be interesting to find January analogues that looked Euro Trough driven with only a weak ridge.
UKMO December chart is exactly as my primary analogue pack suggests.
-
1
-
-
Slow on IPad, fine on desktop, bad request on phone.
-
01NOV2023: Nino3: 2.1 , Nino3.4: 1.8 , Nino4: 1.4
New peak in 3.4 and 4.
ONI for ASO was confirmed as +1.5, the first five months are the warmest since 1997 (also beaten by 1975 and 1962). At 5 tri-monthlies, this is now official.
-
7 minutes ago, damianslaw said:
Another factor was the NAO in May, a negative one meant higher chance of a cold winter..
I think the tripole was in evidence in winter 05-06 and 10-11, correct if wrong. Good to see if the theory is correct.
Does a strong hurricane season enable colder waters from the depths of the mid atlantic to come to the surface, allowing for the cooler band of SSTs?
The May thing was actually sub-tropic SST anomalies. Basically, cooler around the Azores and warmer around Labrador. But the correlation was weak.
-
16 hours ago, razorgrain said:
Really seems to be a lot of mixed signals to be honest. Some hinting towards cold, others hinting towards mild. I get the impression it'll meet half way and winter will be largely average.
TWO on Twitter did mention the possibility of an Azores high for January and/or February though. Typical really, I joked that we'd get it in the dead of winter rather than July or August when it's useful.
Loosely speaking the PDO and QBO are likely to be supportive of -AO. ENSO is too somewhat (not perfect and assuming it says below 2C).
IOD and Solar are generally regarded as more hostile IMO albeit secondary indicators.
In terms of ENSO although they were much weaker events the placement of the standing waves is apparently closer to the 02/03, 04/05 and 06/07 events which did feature Azores driven spells (though I don't consider them primary analogues personally).
-
1 minute ago, sebastiaan1973 said:
From Eric Webb
He's wrong on the MEI, there's been debate about that elsewhere.
-
1
-
-
Can't post the image as on the phone but the link below shows the answer to why we've moved to a more normal zonal outlook in recent days.
For anybody who can see my prior post a few days ago, we saw a significant WWB going to set up just east of the dateline while we now see that the west Pacific will see a powerful WWB with dregs crossing the Pacific afterwards. Hence, we now see a tropical output more supporting of a relatively normal November pattern albeit we still may see something more palatable heading towards the final third.
-
1
-
-
While I doubt we will see such a contrast, do we know what the first halves of 2005 and 2010 averaged.
-
3 hours ago, bluearmy said:
Delete button has gone.
-
-
4 hours ago, Airedalejoe said:
I don't have figures but in my little part of the world 2023 is the wettest I've known. It's incessant at times. The very wet weather started about 12 months ago and apart from very brief breaks has continued.
A horrible summer, very wet, cloudy and cool was followed by a very wet autumn.
I'm amazed we've had 5 frosts already.
This October was very wet but as a year it does not compare to the memory of 2012 from April onwards.
-
1
-
-
1 hour ago, kold weather said:
Even that isn't strictly true, taking the coldest 12 days in Feb 12 vs Dec 2022 comes out at -0.8c for Feb 12 and -1.1c for Dec 22.
The coldest 5 days also were colder in Dec 2022 (-1.1 vs -2.5) and Dec 2022 had the coldest day as well (-4.5c vs -2.8c)
By most measures the December 2022 was colder than Feb 12, the only thing Feb 12 has was that it lasted a little longer if you include the last few days of Jan 12 as well.
I was going by the lowest CET value. Unless my memory is wrong then i believe the CET fell to about 0.8C on 18th December while the first half of February 12 averaged below 0C. Thus as you allude it's possible that Dec 22 was simply mistimed (i thought we were cold from Nov 29th but perhaps not) and that Feb 12 just lasted longer at the right time.
Edit: Took another look and it looks like i was marginally wrong but it is mainly timing. Feb 12 was still below 0C to the 13th but the first half was narrowly above 0C. December 2022 fell to 0.4C to the 17th and the first half was 0.8C. So Feb 12 does have a narrow CET win but probably due to timing when comparing halves. As December is warmer, the anomoly was however greater. Hence why the first half was the 12th coldest (i.e a top 5%) event.
-
1
-
-
1 hour ago, damianslaw said:
Yes wasn't sure if Dec 22 beat Feb 12, it did. As said whilst not up there with significant cold events, it was notable in these warming times. Reference to 'without a SSW', relates to Dec 22.
As mentioned the UK can produce homegrown cold, with pressure high over it, don't need very cold uppers, much as often happens late spring/early summer.
Feb 12 had the colder CET (sub zero) for the spell but was seemingly less consistent throughout.
-
49 minutes ago, blizzard81 said:
I remember people on this forum saying exactly the same back in 2006/07 etc. Then 09/10 happened. Then in quick succession Dec 10. I think think there could be some deja vu about to surface.
Those of us still around from back then may remember a great member called Stratos Feric who solidly explained why statistically, 3C was our new floor. Just before the winter of 08/09. Sadly he's not been around since.
35 minutes ago, damianslaw said:Whilst not prolonged or what you could describe as severe freeze, last winter pulled out a 10 day notable cold spell 8-18 Dec, on a level perhaps only achieved since Dec 10, once, in Feb 2012, correct if wrong. That spell came without a SSW.
Feb 12 was the result of a failed SSW attempt in January. A bit like the late Jan warming this year was enough to change the pattern for Feb, that was enough to give a cold thump in anotherwise pretty poor winter.
-
1 hour ago, CryoraptorA303 said:
Fair enough, I remember Autumn 2021 as being the driest and sunniest since 2011. I think November was the most anomalously driest.
I had a feeling this October was going to be a very wet one.
The years I was using for analogues did suggest the broad pattern, hence the high rainfall prediction. Got screwed by the opening third though on the CET.
I don't recall much of Autumn bar snow in late November. In terms of sunshine the only one that stands out is 2016 in memory. Most Autumns are fairly forgettable though as a whole.
-
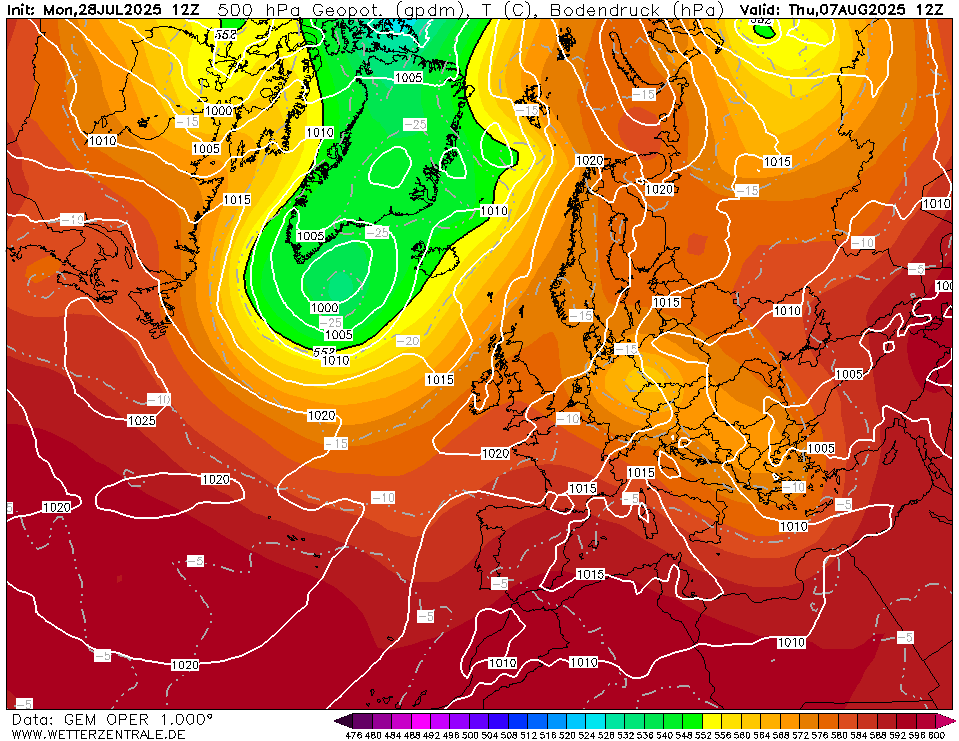
GEM going for the pressure build to the north/east option as i alluded to earlier.
-
7
-
-
Rolling CET for November-October fell to 10.92C. Probably close to the end result since November and December should be close to cancelling each other out bar any abnormaility.
-
Personally i don't expect the Euro 0z today to be correct and think that the GEM/GFS0z will be closer to the mark.
Essentially, there are some years like summer 2022 where the weather is completely confounding (at least to me) however since late summer, our weather (though a higher amplitude scale) has done exactly what i'd expect it do based on topical convection. That basically supports our northern blocking lapsing by the time we end week 1 (so fine with the model on that) but then something more akin to blocking to the north and east (so a Scandinavian or Sceuro High) for week 2 before the pattern cycles again (trough to the south/west) for week 3. As such, i don't really buy the current modelling of full on zonality and suspect this will weaken (you can see that the GFS0z and GEM0z could go down the route i expect).
-
4
-
-
Interesting tropical profile during October. You can see that we have cycling through Pacific waves with a dead Indian Ocean (loosely, MJO phases 4-5-6-7-8-1) however this has been superimposed with a retrograde standing wave.
Original post: https://community.netweather.tv/topic/99428-model-output-discussion-mid-autumn/?do=findComment&comment=4945155


Daily weather observations - November 6th to November 12th
in Spring Weather Discussion
Posted
Coldest temperature for 11.00 this season. 3C and light fog.