


Lynxus
-
Posts
2,951 -
Joined
-
Last visited
Content Type
Forums
Blogs
Gallery
Events
Learn About Weather and Meteorology
Community guides
Posts posted by Lynxus
-
-
Weirdly a lot of convection here now.
Maybe thats a good thing
-
 1
1
-
-
Zero convection here.
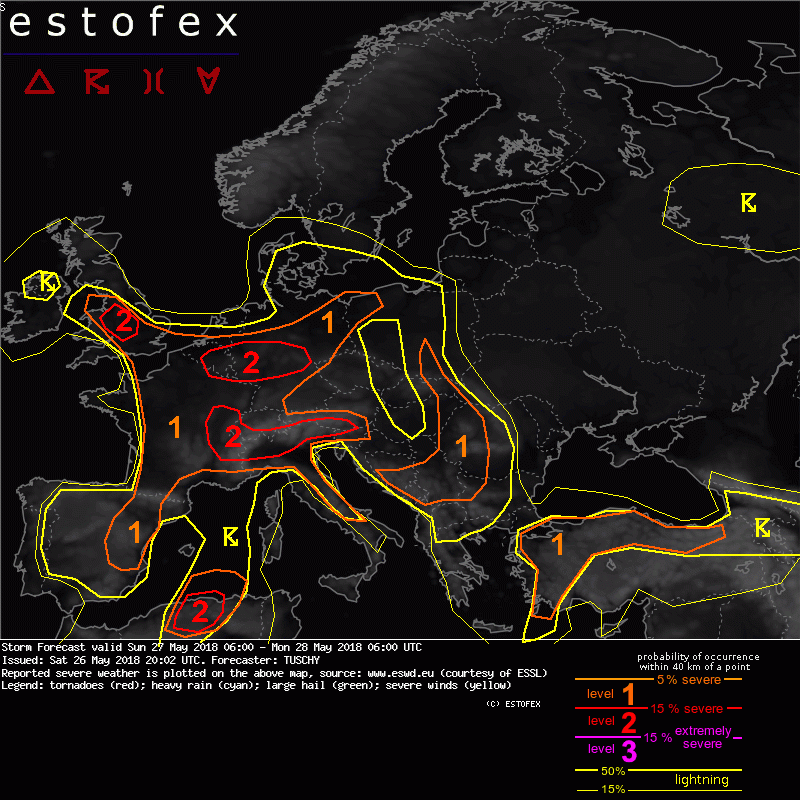
Just on the edge of the level2 warning from estofex. . One can only dream.. Too north for the storms yesterday and too south today
")
-
Sudden ignition everywhere.
Woop woop. Think im too far south for fun today.
Good luck!
-
http://www.dailymail.co.uk/news/article-5774319/Britain-heats-86F-Bank-Holiday-weekend.html
HAS SOME LOVELY PICTURES FROM TONIGHT
-
GETTING CLOSER!
Plz baby..
-
1
-
-
3 minutes ago, MartinD said:
A few flashes starting to show up now on this live London cam
Wow, its like.. 2 flashes a second. That is one hell of a storm.
-
London is pretty much vanishing.
-
Just now, Alicol said:
Thats better
They have an APP btw,
with alarms and stuff.
-
2 minutes ago, Alicol said:
Looking good
Oh lawd
Please just use blitzortung.
-
One thing i will say is that is very weird to see so much INactivity in Europe. Seeing so much close to home is just .. odd.
-
Ohhhhhh its happening!
Not far now!. Many beeps now.
-
8 minutes ago, Allseasons-si said:
Yep
where are you at the moment Supa.
Hells yeah!
Its official when estofex have a level2!!!
-
Huge towers to my south here.
Wow, some people gonna get some great views tonight. Next load expected to start down south in an hour or so.
-G
-
2 minutes ago, tomjwlx said:
Like that!
WOAH!!!!
FLASH FLOODING! Kangaroos in the road. People looting! Its gonna be crazy!
-
4
-
-
1 minute ago, StormChaseUK said:
That MCS will drain all the power from anything around it, it's overnight more favoured conditions will produce fresh storms in places
Oh havent you seen?
Its gonna look like this later! /s
-
5
-
-
2 minutes ago, Ben Sainsbury said:
If we take a look at the cloud height on the Sat24: https://en.sat24.com/en/nl/km
It is clear for the most part that the storms in the far SW are decaying.
And if anything the very large active storm possible MCS over France is maintaining, if not growing in size. We should expect further activity by 7/8pm.
Isnt for the most part unstable air in the shaded area?
I suspect things to kick off properly down south/SW in about an hour.
-
Wont be long now.
Activity starting in the SW.
-
1 hour ago, Lauren said:
Thanks Harry. I've got that but what exactly is it I'm looking for that says storms?
I personally look at a few things.
Storms are generally caused by converging different masses of air. (Ie, hot air hitting cold air) , This difference creates the condensation, convection etc needed for larger clouds, storms and in extreme cases tornadoes etc.
There is a good guide here about UK storms:
That said, Here is what I look for.
Sea level pressure, Gives a good indicator of air masses, Their direction and where you sit between them.
This shows the UK being suck between pressure systems.. So we have movement.. Air is moving about.. Its not like we are stuck dead under a high pressure system.
I also look at wind directions.
These can show where air is "converging" and likely a good place where storms may be.
Precip charts are obviously a good chart to show where rain and intensity may be... Its a bit of a cheat, but shows it none the less.
Cape and Lifted index is also a good one to look at.
These show how much potential energy is about for a storm to use and the lifting values along with it.
Strong cape values and low lifted values are good indicators. Lack of these doesnt mean no storms but with it can mean bigger and more likely storms.
The above 3 charts all show the convergence line, the PPN and cape values in the same place roughly. This is a good sign for say 09:00 tomorrow morning that the south of the UK have some big storms.
There are other charts can help bolster out the detail but this is a good indication.
There is also a storm risk chart that is useful for confirming your thoughts.
-----------
This afternoon does indeed look good for the south.
-
3
-
-
Storm just south of me here in gloucester.
Seems fairly active currently.
-
14 minutes ago, Vestan said:
And so begins the annual inevitable disappointment when nothing happens in my area! Still, I think the anticipation is almost as exciting.....
I used to get so excited about the storms. Id go chasing them half way across the country mostly to find disappointment.
Unless estofex have a level2 for my area etc, I dont get my hopes up
-
1
-
-
Just now, Jason74 said:
Page 3 models?
Dont be daft.
They wont be out in this weather.
-
Heavy snow here.
1p sized flakes.
-
Just now, PerfectStorm said:
Looks good for you guys, no doubt! Not jealous...
Fingers crossed!
Been having steady small ice snow for hours. Probably a good 2 inches in general. 10+ in the drifts.
Even had snow pushing under the fire escape down the local
-
2
-
 1
1
-
-
Just now, PerfectStorm said:
I assume that's just cloud thickness? Could mean anything. In york, the dark reds were over us and there was no precipitation.
Yeah 100%.
I still suspect a fair amount of PPN from the thicker stuff on the south.


Convective/Storm Discussion Thread - 19th May 2018 onwards
in Storms & Severe Weather
Posted
Can see the beast north of me now.
Seems to be growing southwards while moving north lol