


Nouska
-
Posts
1,331 -
Joined
-
Days Won
4
Content Type
Forums
Blogs
Gallery
Events
Learn About Weather and Meteorology
Community guides
Posts posted by Nouska
-
-
- Popular Post
- Popular Post
1 hour ago, karyo said:Intriguing ECM! It shows the creation of that deep little low in the 120-144 hour timeframe which then heads for the UK. I wonder if it may have some tropical characteristics as it starts its life not far from the Azores?
I notice that the UKMO doesn't have this system but it does have a hurricane in the Caribbean instead (see 168 hour chart)!
Tropical Tidbits has a useful feature for looking at the Atlantic basin - you can go back three days on the model and thus see where this low has genesis. The energy is generated from the remnants of tropical storm Emily and a train of little tropical waves that are circulating round the high.
Emily over Florida on first of August.

Then follow the run and see the development.
-
 12
12
-
8 hours ago, karyo said:
It seems that Saharan dust over the tropical Atlantic is keeping things quiet.
Does anybody know why the dust has this effect?
Very simply, tropical convection needs a moist atmosphere at height to get the hurricane building towers to develop and thus form a stable core. The dry Saharan air aloft inhibits this ability and it also cause disruptive shear.
There is a very strong CCKW (Convectively Coupled Kelvin Wave) due in the Atlantic next week - that should moisten out the upper layers and may lead to some development for later in August.
Impacts of Convectively Coupled Kelvin Waves on Environmental Conditions for Atlantic Tropical Cyclogenesis
http://journals.ametsoc.org/doi/full/10.1175/MWR-D-11-00305.1
-
3
-
-
If you read any of Ant Masiello's tweets you'll have noticed that he was suggesting the Atlantic would become more active after the solar burst in mid July. Might just be coincident but pattern changed substantially following the most recent geomag events.
Some recent research and it is not behind a paywall.
http://onlinelibrary.wiley.com/doi/10.1002/qj.2782/full
A useful tool for checking detail on current activity.
-
8
-
-
20 minutes ago, knocker said:
I'm not absolutely sure what you mean by this. Are you suggesting that experienced senior forecasters at Exeter do not have the background or qualifications in atmospheric physics to understand teleconnections? Connections which at best remain theoretical for pressure distribution in the eastern Atlantic unless one can take all signals into account and even then.............. Any enlightenment would be appreciated
I cannot answer for Singularity but I take it that he refers to the lack of a proven connection in the literature rather than a lack of understanding among the scientific community. I've not seen any teleconnection graphics on any of the big science sites that point to a strong link between Pacific placed convection and UK summer weather. There is a tentative suggestion that Indian Ocean activity may have more influence.
As an aside and purely just a thought - the last time we saw such a UK centred cut off low - solar activity was rapidly declining and looked very similar to this:-
Another summer where long range models showed vast swathes of positive heights but failed to pick up the tiny and persistent trough that blighted UK summer.
-
6
-
-
1 hour ago, knocker said:
Had a visitor down at the lake this morning, obviously a member of the heron family, but stupid as it sounds I'm having a bit of trouble identifying which one. I'm thinking Grey without many black bits
It's one of this seasons hatchings - typically uniform grey except for the 'baby' speckling on the breast feathers.
-
3
-
-
Re the conversation about Yorkshire - checking the 00Z ECM det and 06Z UKMO (via London WAFC) looking pretty cloudy and wet tomorrow afternoon. As of this recent run, thunderstorms are expected at 15Z as witnessed by the CB hazard charts.
-
2
-
-
34 minutes ago, Singularity said:
Good point snowwman, I have been surprised by the pace of both strengthening and downward propagation with this E QBO.
Only recently I was reading an article that suggested the most major contributor to the unusual 1962-63 winter was an exceptionally strong E QBO (if only the Berlin data archive went back that far!).
Let the hype begin
It does!
Read numbers from right (10hPa) to left (70hPa) for progression downwards. Months are the second column on the left.
http://www.geo.fu-berlin.de/met/ag/strat/produkte/qbo/qbo.dat
-
4
-
-
7 minutes ago, Nick L said:
Turned out not to be do-able, sadly. I can from the Euro4, however. Will give them a go in the morning.
The French models have soundings and hodographs - ARPEGE for all UK and the south only on AROME
http://www.meteociel.fr/modeles/sondage_arpege.php?region=uk&ech=3&mode=2&wrf=0
-
1
-
-
7 minutes ago, mb018538 said:
Wonderful eh
Nice to see our old friend GFS forecasting 28c for London today at T0-12, going to be 4-5c wrong again!
AROME has a little patch of 33C NNE of London - you might be right in your assumption.
Fun to see what the model anticipates for tomorrow in sim-sat IR format.
-
3
-
-
19 minutes ago, 40*C said:
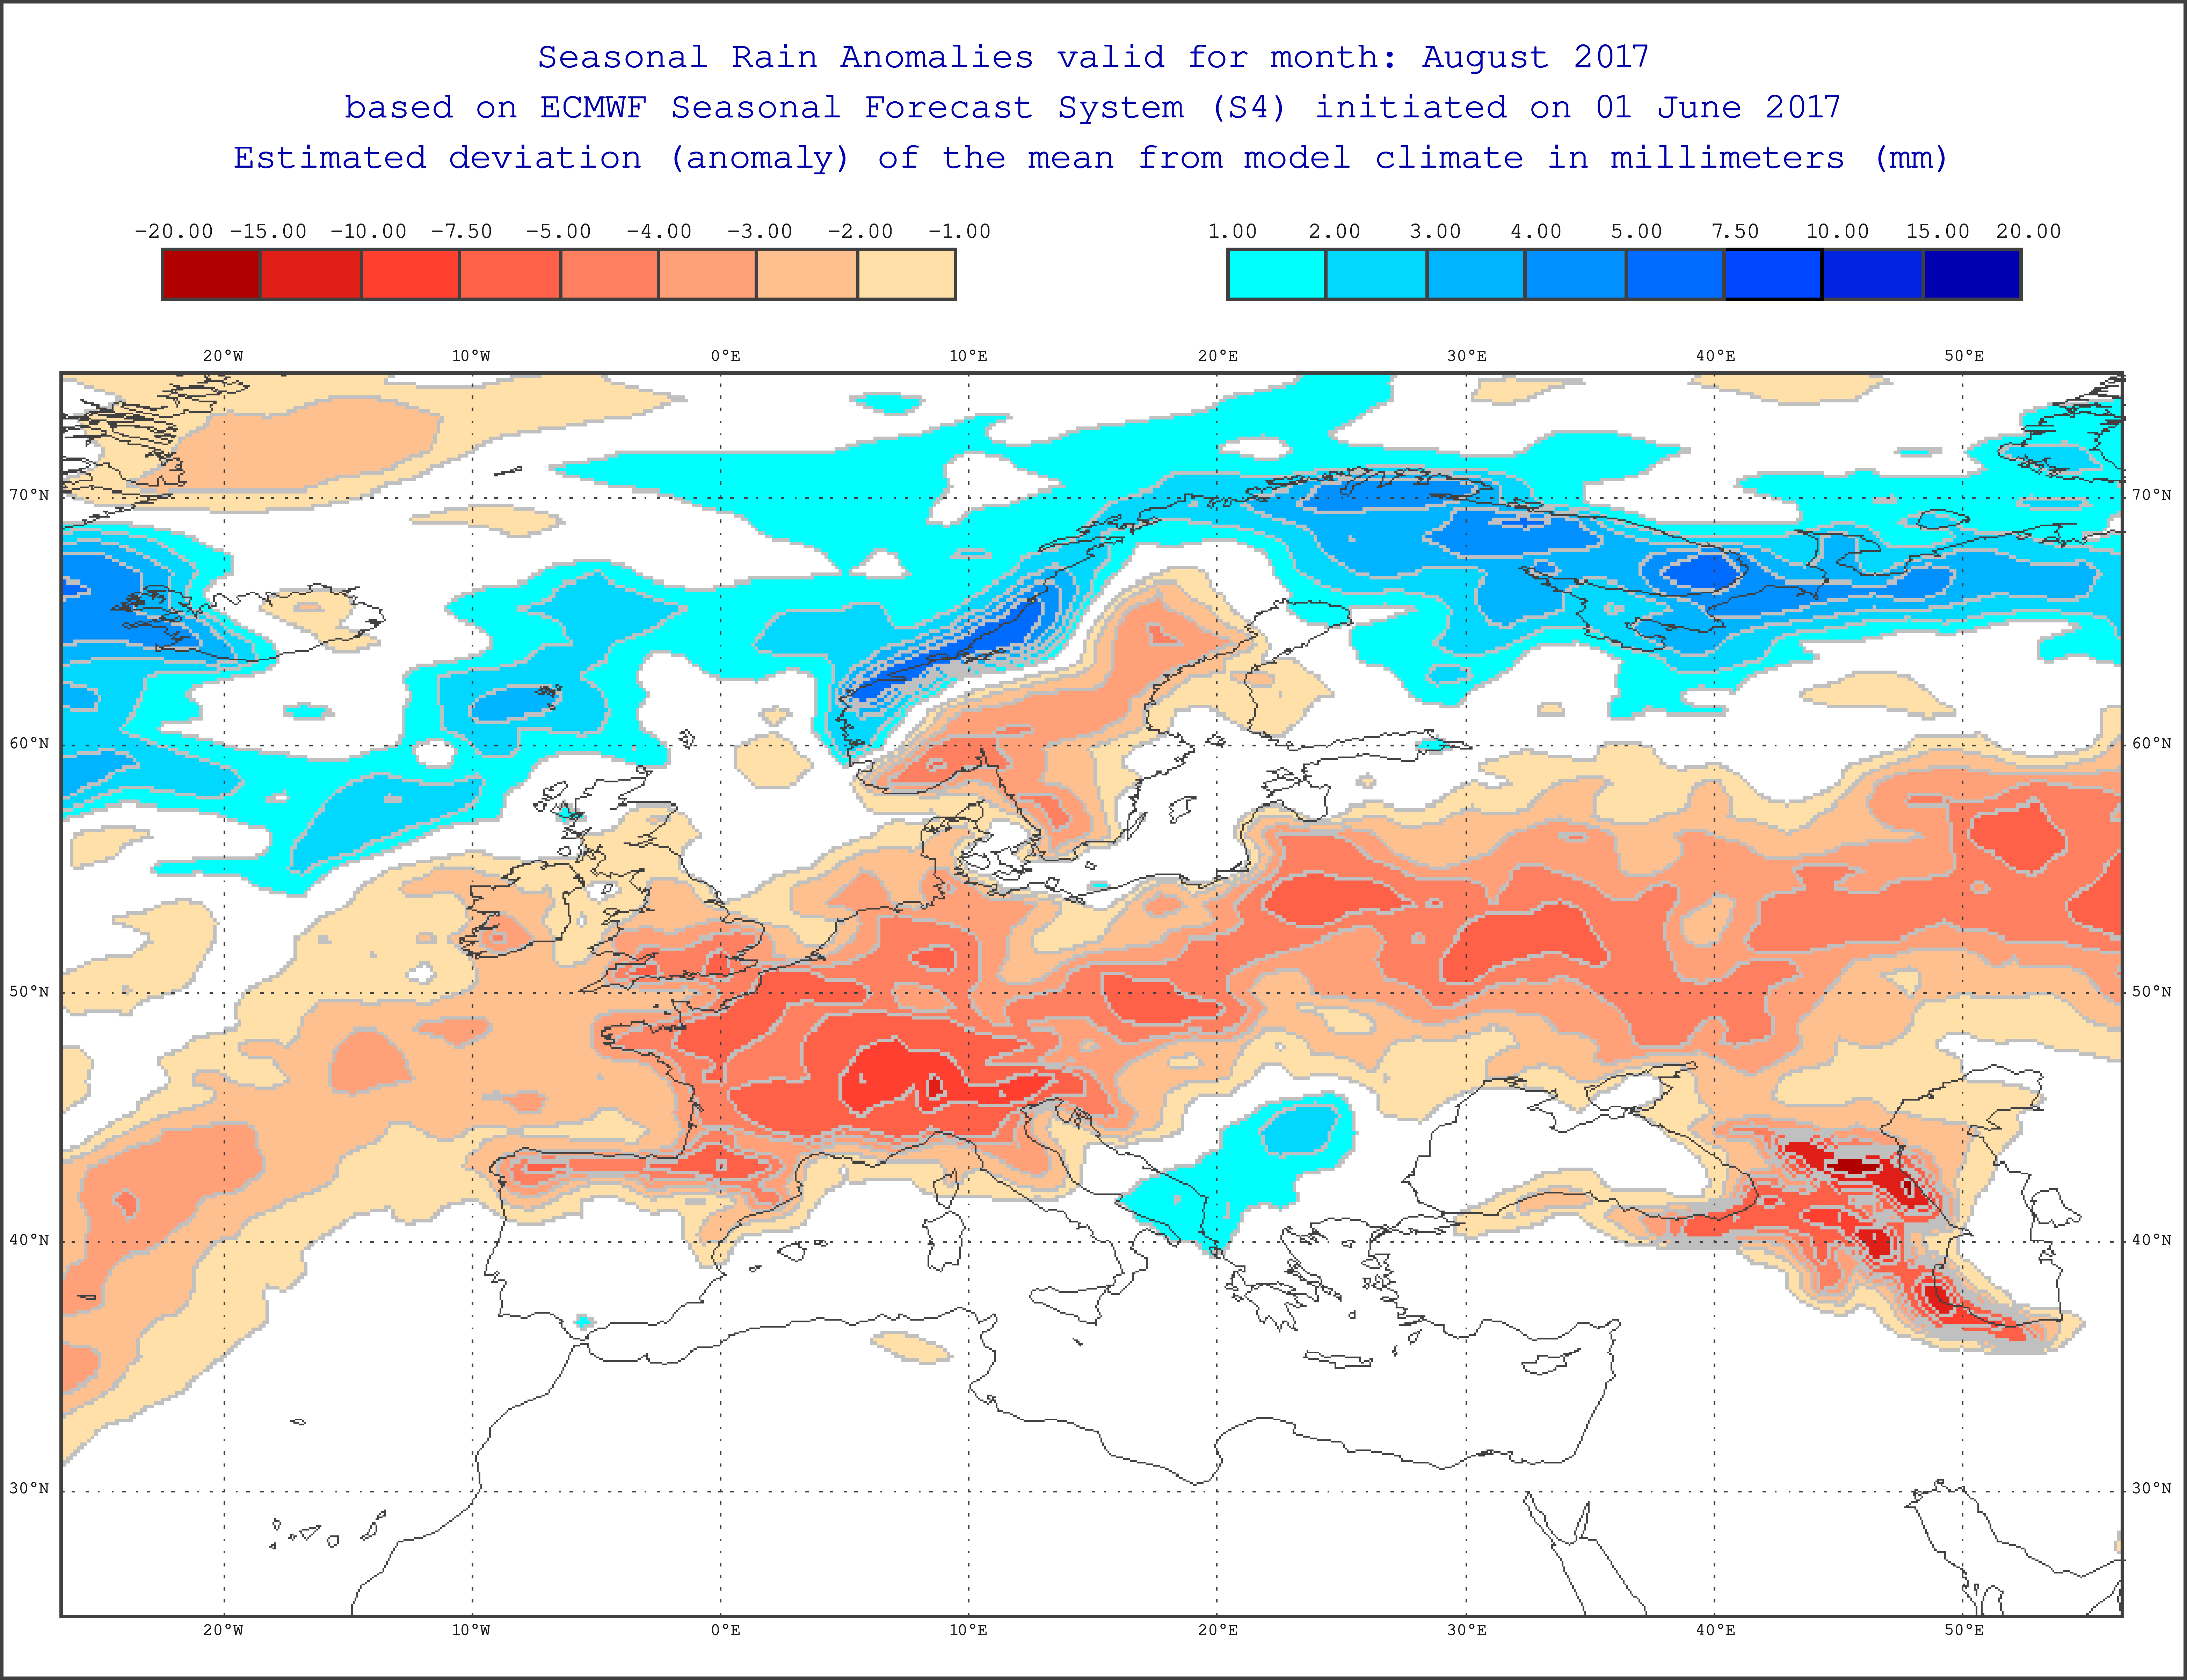
Anomalies aren't pointing to that I'm afraid its all down hill towards a colder, wetter than average first half of July.
The week three ECM height anomaly chart shows lower heights straddling the north of the UK and the focus of the ridge down to the SW.
This configuration shows a rainfall deficit.
We know that the models, particularly GFS, have been frequently trying to introduce low heights in the late stages of the runs but as time counts down, the ridging has the won the day. Whether it continues to be the case, time will tell. So far, this summer, the EC has had a better performance than it did in winter - it would be very unusual for no breakdowns in summer and even if two weeks hence turns out as modelled, that is no predictor of what is in store for the rest of summer.
-
7
-
-
53 minutes ago, Singularity said:
Is that based on the BBC? I saw them mention 27*C yesterday.
Arpege showing a little pocket of 27C for the north of London and the first 40C of the summer for down here.
As I said in a status comment, forecasts for here will see June 2003 well beaten - l wonder if some of the suggestions of dangerous heat will come to fruition?
-
9
-
-
- Popular Post
- Popular Post
On 23/05/2017 at 13:48, Glacier Point said:There are two years which illustrate why the coming few weeks will be keenly monitored.
During 1995 and 2007, two completely different summers (dry and warm versus blocked and wet), the evolution leading up to and during the breakdown of the polar vortex was very similar. However, what followed in the stratosphere and upper part of the troposphere were completely different. During 1995, a cooler stratosphere and lower heights extended their influence much lower into the atmosphere and the resultant weak polar easterly flow was characterised by much less blocking. Contrast that with 2007. The extension of low heights was much less, with blocking (positive height anomalies or red shading) much more robust in the lower part of the atmosphere.
Looking at the profile to date, the extension of low heights is impressive and suggests something more akin to 1995 is the case (although there is still some time for similarities with 2007 to rear their head). It is the speed of the atmospheric response to the breakdown of the stratospheric polar vortex that is most telling for me.
I've lifted this from the in depth model thread as it seems pertinent in view of the lovely 12Z run from the GFS. Nice assessment from GP, all based on teleconnections.
You are suffering the 2007 bit currently (get it out of the way quick
) but the 1995 redux is showing in all its glory from next weekend. Just a reminder of what the charts looked like for back then.
-
11
-
18 minutes ago, cheese said:
40C talks nonsense a lot. Ignore him.
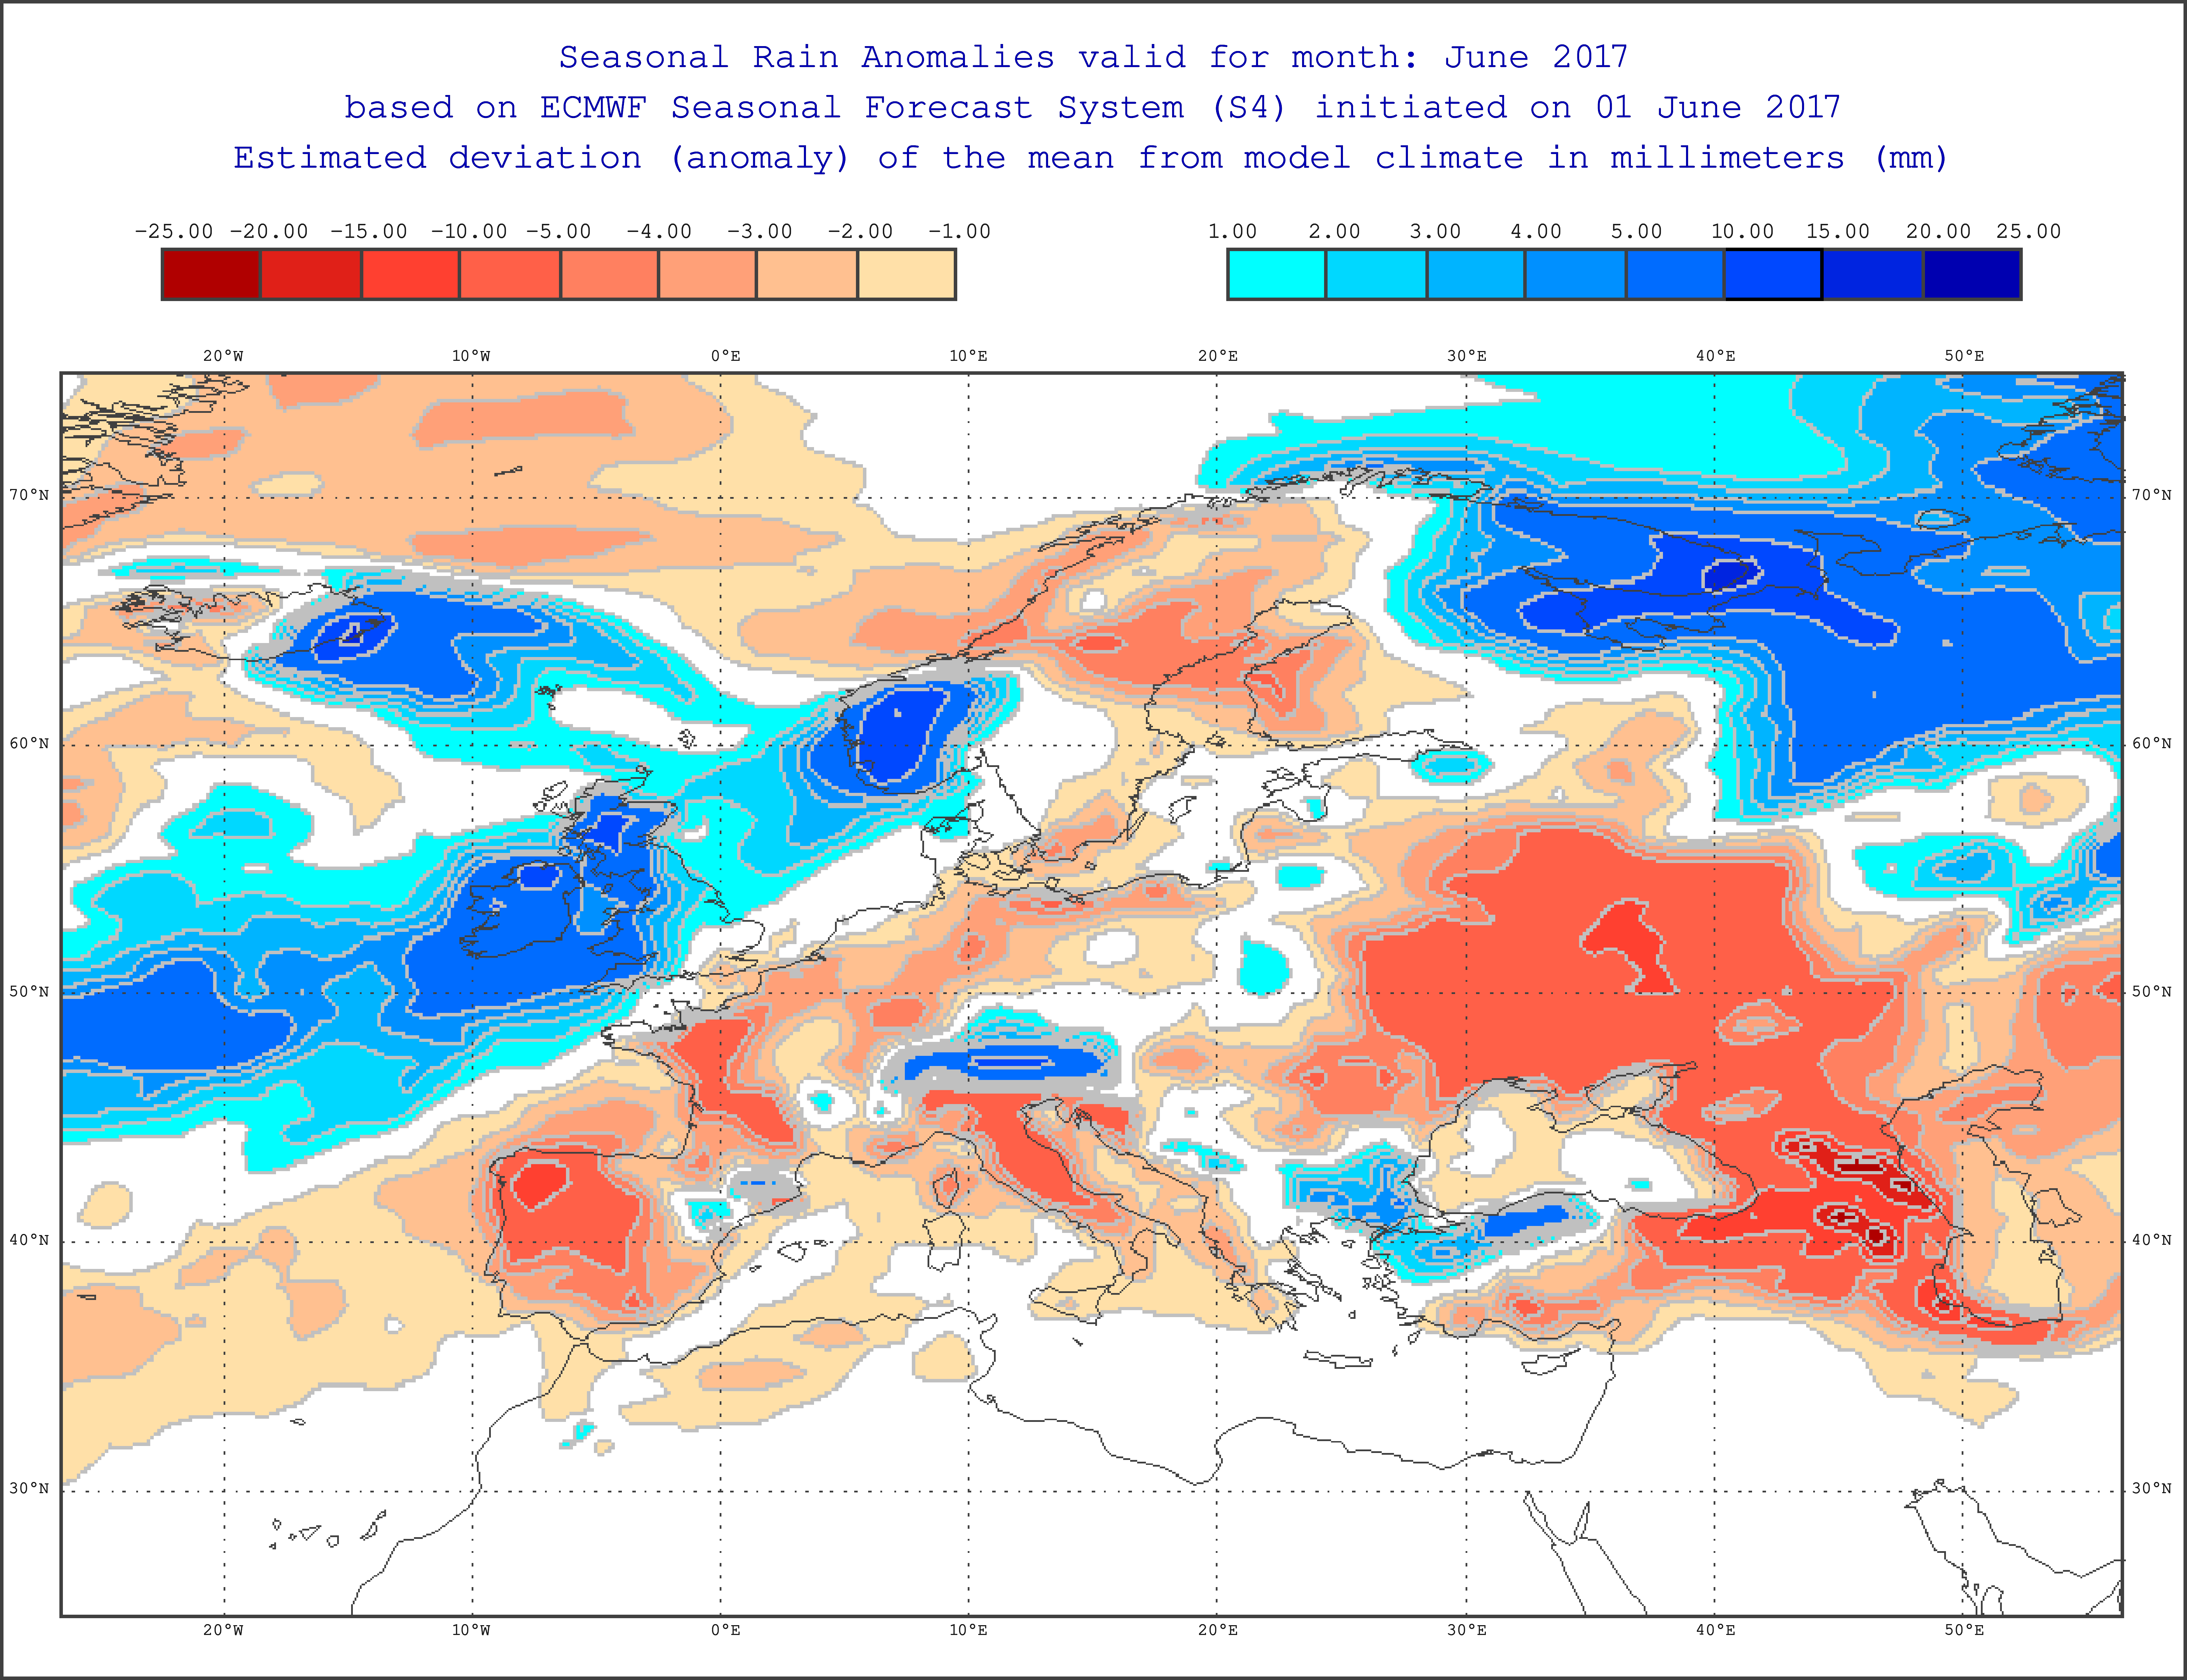
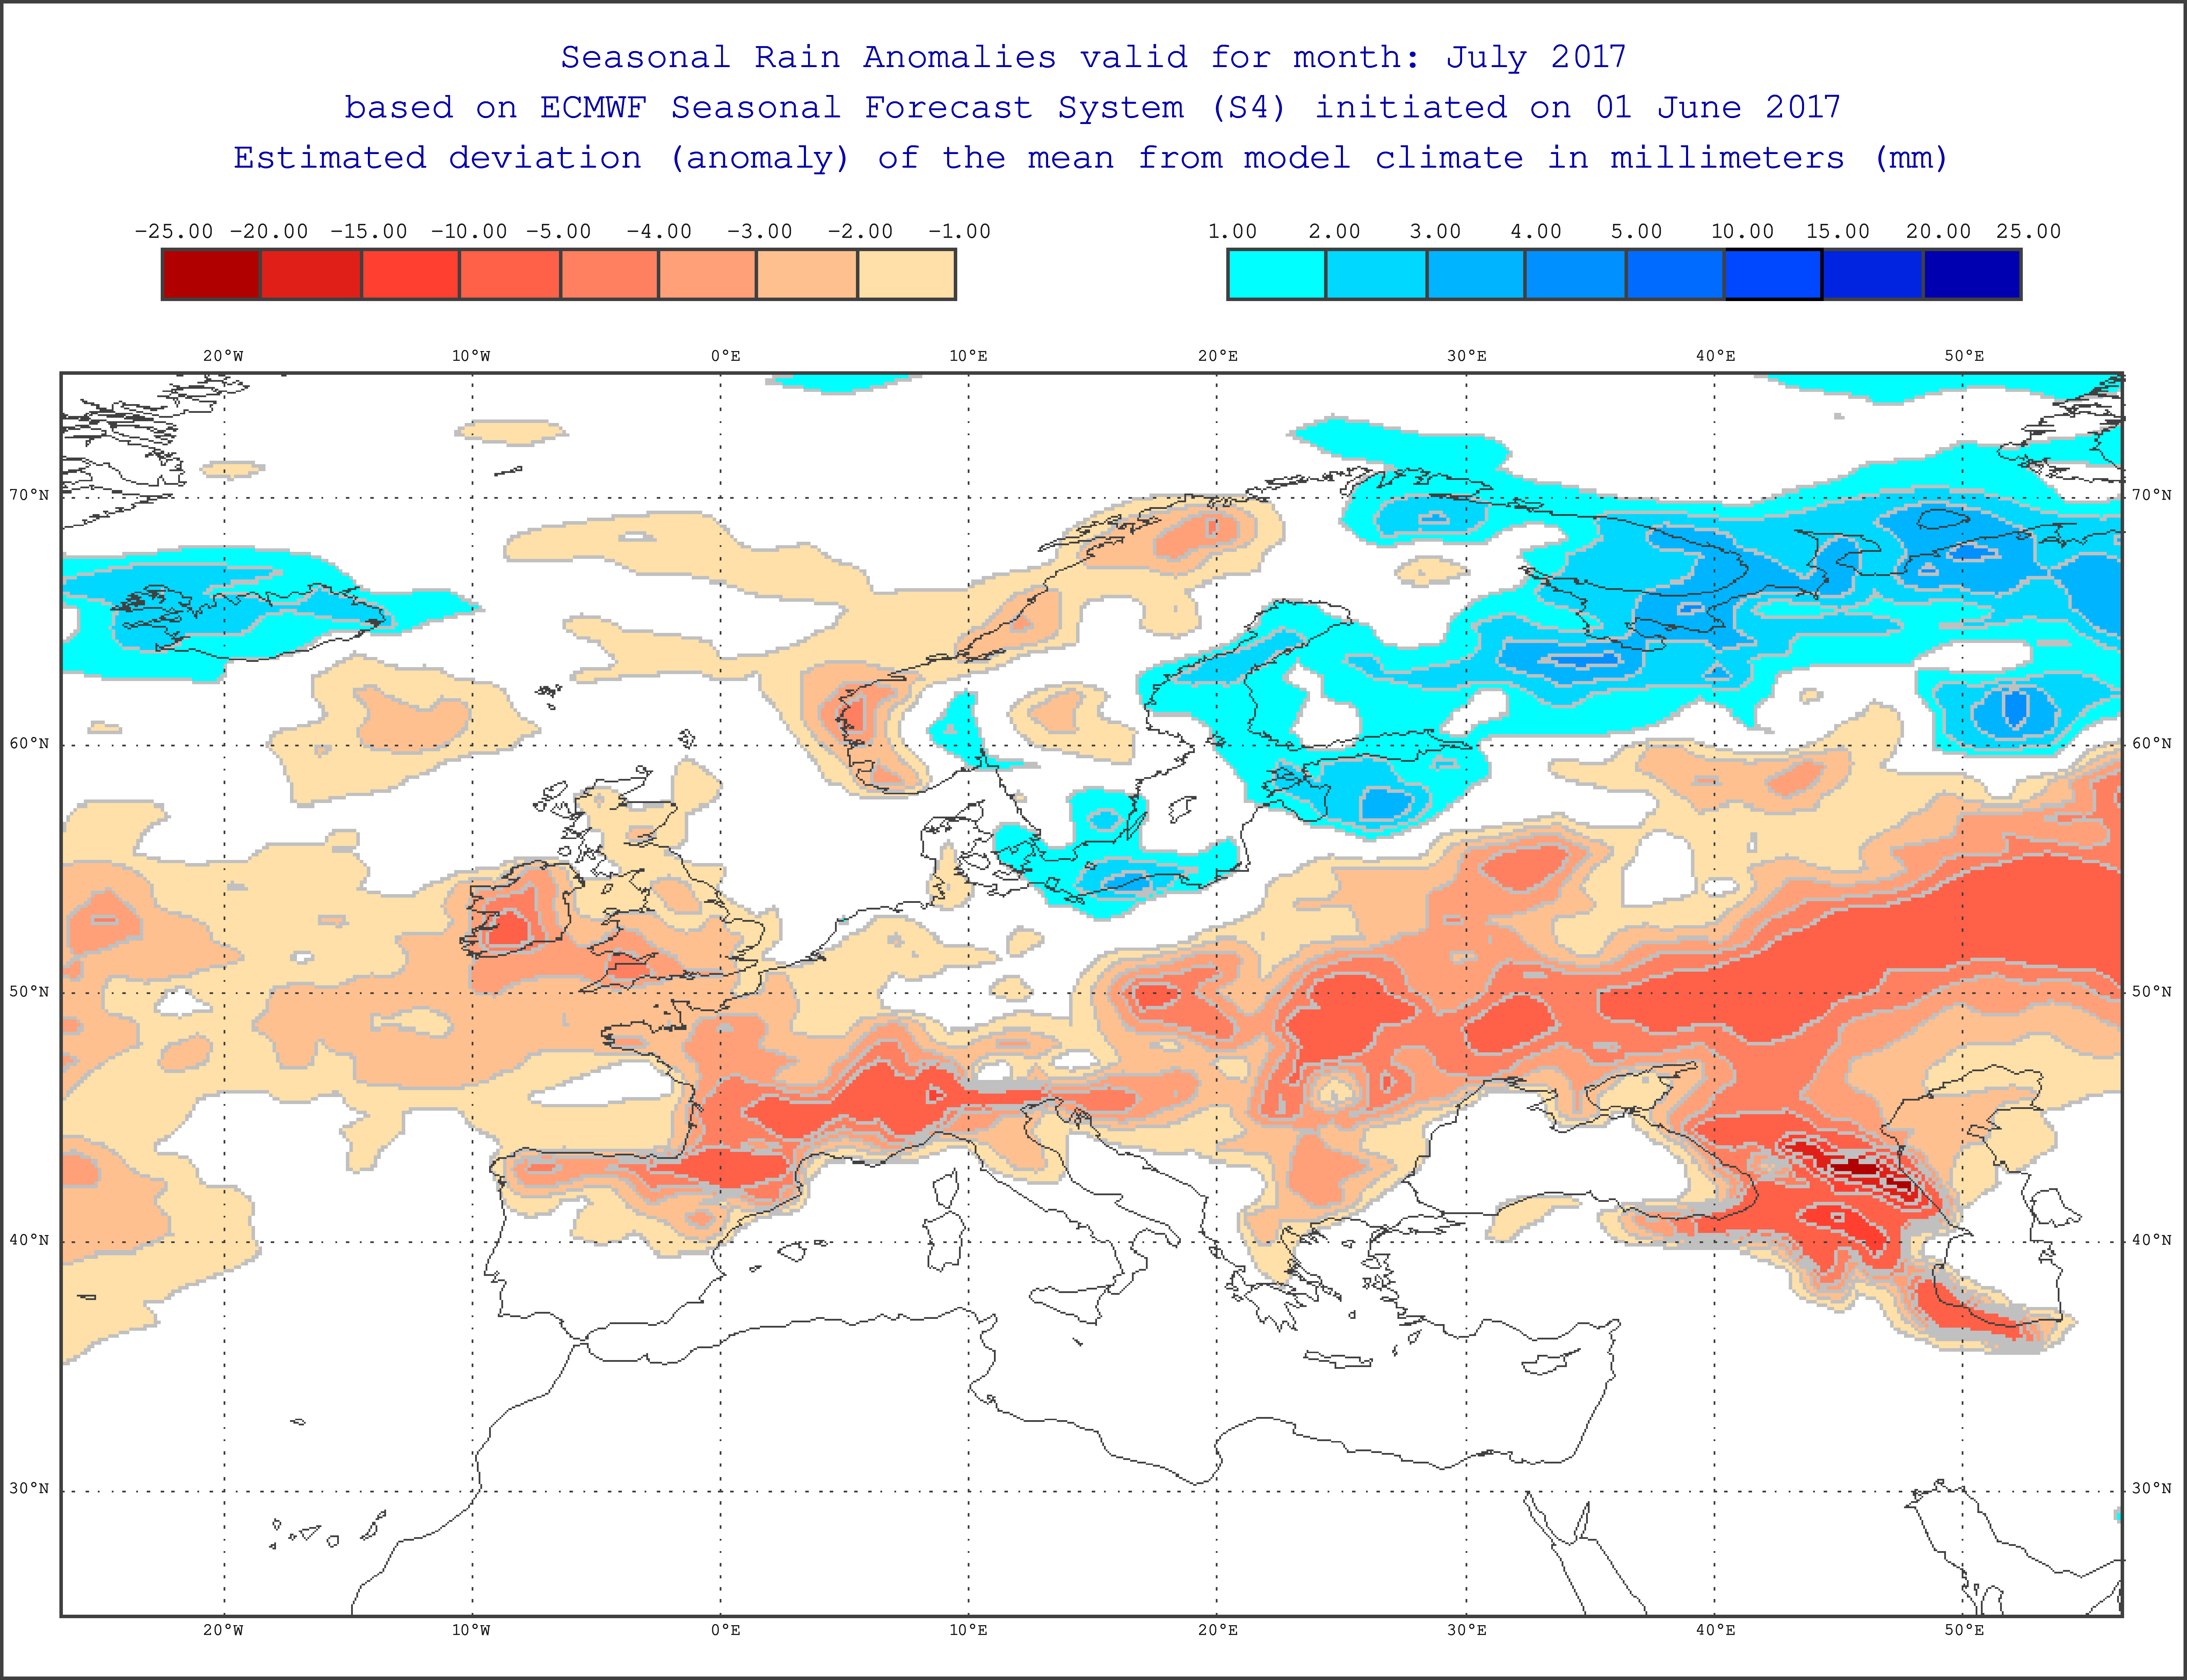
He might not be talking nonsense as far as June is concerned - newly updated EC seasonal has a warm but very wet outlook for this month.
You'll all be pleased to note that the picture for July and August is for above average temps with a very dry signature.
-
7
-
-
A new paper looking at long period central Pacific ENSO trends.
Recent enhancement of central Pacific El Niño variability relative to last eight centuries.
https://www.nature.com/articles/ncomms15386
Discussion highlights.
Taken together, our results suggest that anthropogenic climate change has had a profound effect on SSTs in the CP, whereby anomalous warming over the last decades is accompanied by an increase in interannual variance. NIÑO4 SST values over the last two decades are likely higher than natural variations over the last 818 years, owing to a combination of relatively high CP ENSO activity and a late 20th century warming trend. In light of our results, it seems plausible that the dominance of CP ENSO extremes in the first two decades of the twenty-first century may continue, albeit with some important caveats. First, the global climate impacts of future CP ENSO extremes will critically depend on the evolution of the mean climate state in the tropical Pacific36,37, which itself is poorly constrained at present. Second, the new Taiwan tree δ18O record is the newest addition to growing archive of high-resolution paleo-data sets that can be used to probe the sensitivity of tropical Pacific climate to a variety of external climatic forcings over the recent past. One such example comes from the early- to mid-Holocene, when some models and data suggest that processional insolation forcing may have driven a shift towards greater CP ENSO activity and less East Pacific ENSO activity37. Should the dominance of CP ENSO extremes continue in the coming decades, investigations of the causes, and consequences, of any past shifts towards CP ENSO may provide some clues about future tropical Pacific climate trends and their global impacts.
-
6
-
-
55 minutes ago, Blessed Weather said:
An interesting article in the 'Weather Club' Spring 2017 newsletter, published by the the Royal Meteorological Society.
For once, not behind a paywall.
-
3
-
-
I see the NCAR CESM is the only model in the N. American suite that does not develop a proper Nino signature for the summer. It is quite alone in having a cold patch in the ENSO region for this month and next. It's also forecasting a warm summer for the UK...
All the outlooks from the suite here.
-
4
-
-
Great report there!
Would you say that it was a bona fide case of the polar vortex visiting the UK?
-
2
-
-
After another false lead in February - where to, this month....
I doubt it will be average but best to pick that as options seem to be either very mild or quite cool - depending on ridge/trough placement.
6,8C.
-
11 hours ago, stodge said:
I presume no one knows if there was a vortex split in winters as 1946-47 and 1962-63 or whether that was more about displacement.
One can never be sure how accurate the extrapolated reanalysis is, on charts from the pre satellite era, but there is an archive that goes back to 1851 (20CRV2)
https://www.esrl.noaa.gov/psd/cgi-bin/data/composites/plot20thc.day.v2.pl
This would suggest there was indeed a split vortex at 10mb - prior to the onset of the severe winter spell in 1947.
Geopotential heights anomaly at 10mb - 5th to 10th January 1947 - from NOAA ESRL reanalysis.
The '62 - '63 winter is included in the JMA reanalysis link I gave in my previous post.
November kicked off with a Canadian warming (a displacement of the vortex off the Pole but not necessary for winds to reverse) - then SSW at the end of January.
-
4
-
-
- Popular Post
- Popular Post
The huge low pressure system in the Atlantic, with very cold uppers, is giving rise to a lovely convective 'rash' on satellite presentation.
-
19
-
10 hours ago, stodge said:
I was interested in the March 2013 profile because even though it was a very cold spell for western Europe, it took place with a strong cold stratosphere still in existence and the positioning of the coldest areas looked to be being repeated this year.
Hi Stodge.
The 30mb stratosphere was very different to now in 2013 - after the major SSW in January, the vortex was split asunder and never regained its former strength.
SSW split
This time in 2013
This is what it looks like currently - ie displacement where it is a game of push and shove but no destructive force.
I find it easier to look at animations to see how the season develops - the link I'm using allows you to do this as well as using the drop down menu to change picture. The fact that you have levels for strat, Z500 and surface, allows you to see whether it is upward wave action or downward propagation.
http://ds.data.jma.go.jp/gmd/tcc/tcc/products/clisys/figures/db_hist_pen_tcc.html
An edit to add the GFS 12Z 30mb run in animation format.
http://brunnur.vedur.is/kort/gsm025/2017/02/26/12/gsm025_nhem_gh30_t30.html
The 30mb level is well represented at the 500mb level and if it continues to be so - one could expect a more dipole outlook with the possibility of ridging in the Atlantic and a trough in our vicinity. Amplification is the name of the game but it is where this actually sets up as to whether our narrow corridor of longitude sees mild or something unseasonably cool.
The JMA wants to stick quite rigidly along lines of MJO P2 for second week of March but that is contra indications from the strat!
-
5
-
-
1 minute ago, Matty M said:
Beginning to think this storm will be stronger for Ireland than anticipated. Deepening sooner and faster than pronged. I fear widespread infrastructural damage from Mayo to Dublin commencing 1am in west
Just looking at that on the ARPEGE but the slower to come out (much higher-res 1.3km) AROME is not being nearly as aggressive. The zoom function is way behind - all very slow tonight.
-
2
-
-
On 21/02/2017 at 23:15, Fiona Robertson said:
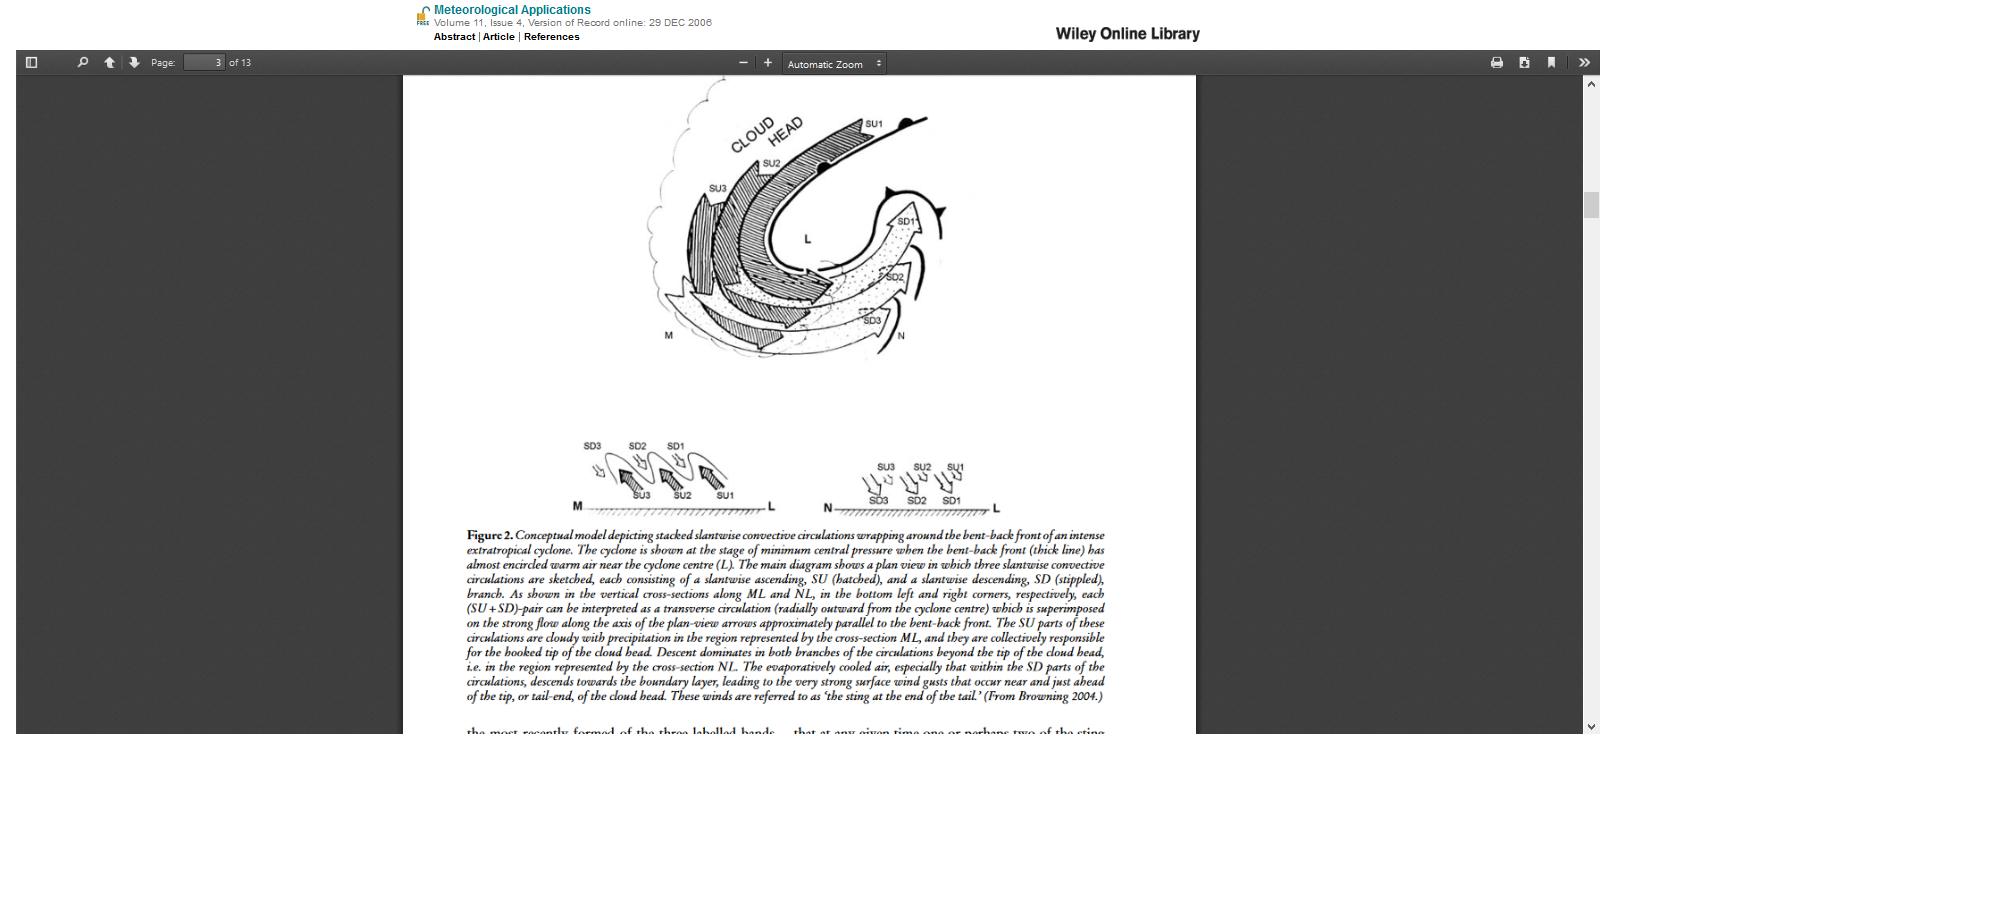
Thanks anyway,I think I'm beginning to see what's going on. The piccie of the St Jude storm with the big black dry area over Denmark has helped.Am I right to think that the wee tip curling into the black area,the very centre of the system, is the sting jet?
The sting jet in the image is just beyond the little curl of white cloud. The dry, cold air descending evaporates the cloud head and gives it the cut off look rather than the traditional swiss roll type spiral banding. A diagram here explains the process and where to look. Open in a new tab and enlarge for easier to read text.
http://onlinelibrary.wiley.com/doi/10.1017/S1350482704001379/pdf
On 21/02/2017 at 23:49, weirpig said:Quick look at the arpege really turns up the wind speeds. Some area could hit over 90 mph. Let's hope not
Looks nasty!
ARPEGE over egged the pudding, leading to our red warning a couple of weeks back but it is usually a very reliable model for this type of extreme wind event.
-
3
-
-
6 minutes ago, Fiona Robertson said:
Ok, I'm beginning to think I'm dumber than I thought I was. I've read all the links given on the sting jet, I've looked it up and I still can't wrap my head around it. I just can't grasp it. The diagrams I've looked at have just confused me more. Is there anyone out there who can explain this to me?
Pictorially, storm Angus had a very striking sting in his tail.
-
2
-


.jpg.51e00a776dfe239edc7570511de803b3.jpg)
.jpg.328ab8869472b520b0beb02d65301372.jpg)


 Great report there!


Arctic Sea Ice Discussion 2017 - The Melt Season
in Climate Change
Posted
I've recently been reading the write up on the persistent Arctic cyclone of August 2016 .....
http://onlinelibrary.wiley.com/doi/10.1002/asl.757/full
Are we going to see a reprise for 2017?