


Nouska
-
Posts
1,331 -
Joined
-
Days Won
4
Content Type
Forums
Blogs
Gallery
Events
Learn About Weather and Meteorology
Community guides
Posts posted by Nouska
-
-
Remarkable similarity between what is being modelled for the 30mb temps/heights and what actually was in place at the end of January 2016.
January 31st 2016

January 28th 2017 forecast
A lot of layers to get through before we see what the impacts will be on surface conditions.
-
 4
4
-
-
The ECM 00Z run prolongs the opportunity for seeing nacreous clouds if clear skies permit. Overhead 30mb temperatures as low as -86C on some of the time stamps - not all shown in gif - just a sample to give idea of movement of the coldest core.
-
6
-
-
27 minutes ago, bobbydog said:
Either way BA, a warming on that scale will have a significant effect on the trop.
Seeing it being forecast is warming my cockles anyway....
Hi, BB the 1991 analogue does make a single chart entry in the upstream analogues.
From reanalysis I did yesterday on the past January SSWs - 2006 looks a good match for geopotential heights at time of reversal. The map below shows the forty five day surface anomaly following the event in 2006.
Nothing remarkable in CET figures for February but looks like it was a cold March. The summer that followed would be nice to see again, though!
-
7
-
-
- Popular Post
- Popular Post
A bit of time indoors on this cold afternoon so did the geopotential height 10mb charts for all the January SSWs listed in the ESRL link on the last page.
https://esrl.noaa.gov/csd/groups/csd8/sswcompendium/majorevents.html
I've used dates just a day or two before and after the reversal to capture the picture and the variance in the data sets . If anybody wants to do other levels or the February SSWs, the ESRL reanalysis site is below.
https://www.esrl.noaa.gov/psd/data/composites/day/
'58
'60'70
'71 '85
'87 '02
'03 '04
'06 '09
'13 An edit for two that are on ERA40 but not on NCEP
'63
'68 -
10
-
5 hours ago, bluearmy said:
Not till next week Kevin (and I suggest we need clear skies !)
Yes, that will be the imortant thing! - the temperature conditions at 30mb look OK with -80C overhead from around the 24th - even colder in the north by the 27th going on latest ECM run. This does not dig as far south as last year so I wonder if opportunities will be as good over all the BI.
3 minutes ago, bluearmy said:Can anyone point me towards a historical site where I can view strat height charts (10hpa to 50hpa). (Want to see the upper strat charts evolution where we have seen a quick trop response to a SSW)
There's geopotential heights data on this site - back to 1958. Levels not as you asked but does 30mb, 100mb, 500mb and SLP. Available as 5 or 10 day segments, monthly and seasonal.
http://ds.data.jma.go.jp/gmd/tcc/tcc/products/clisys/figures/db_hist_pen_tcc.html
-
2
-
-
- Popular Post
1 hour ago, mcweather said:Not really MP-R Seasonality's description is a pretty good analogy of the U.K. Climate which is on the whole a mild maritime one with our weather coming at us on a west to east track off the Atlantic. Yes the text books may say we can be affected by six different airmass types but the reality is the ones from the west or southwest or south will always largely out weigh those from the north, east or southeast in any given year. Which of course is the reason that this place goes into meltdown when a sustained flow from the north or east is shown.
Fergie often mentions in his posts about the longer range models returning to climatology and our climatology is without question a mild maritime one and that climatolgy means the dice are very much loaded against sustained cold and snow especially in lowland Britain. Which Is why despite being in my late fifties I can count the genuinely long cold and/or snowy periods in my life on the fingers of two hands.
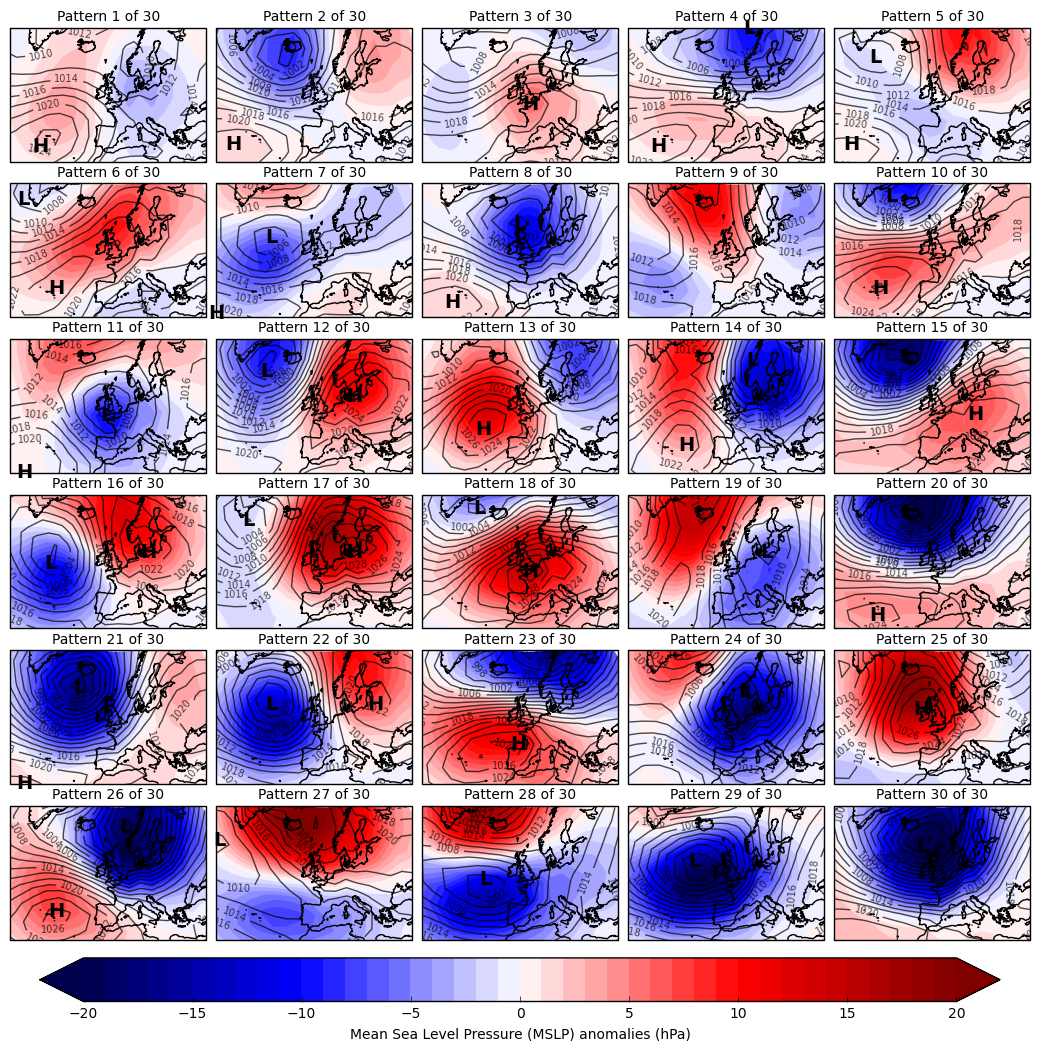
The UKMO have recently updated their DECIDER weather regimes and in those six airmasses they identify thirty variations. The numbers 1 - 30 are listed in frequency of occurrence :-
Patterns are ordered according to their annual historic occurrences between 1850 and 2003, which was the period used to generate the patterns. Pattern 1 occurs most often annually (around 6.5% of the time) and Pattern 30 occurs least often annually (around 1.5% of the time).
http://www.metoffice.gov.uk/research/news/2016/new-weather-patterns-for-uk-and-europe
I've posted this before but it is interesting for anyone who has not seen the update.
A presentation of how they make use of this in forecasting weather risks.
http://presentations.copernicus.org/EMS2016-127_presentation.pdf
-
12
-
- Popular Post
Some posts looking at the similarity to a SSW in 1991. The current and historic charts may look similar at face value but don't tell an important aspect of the '91 event.
The first warming took place end of December/beginning of January. Not replicated this year.
The second phase - middle of January to early February.
The important factor, IMO, was the split that isolated a connection to western vortex segment and allowed a mega Scandinavian high to develop.
Z 500 anomaly
I don't want to rain on anyone's parade but perhaps better to be aware that current modelling is not showing a '91 redux at the moment.
All historic images from here.
http://ds.data.jma.go.jp/gmd/tcc/tcc/products/clisys/acmi.html
-
13
-
- Popular Post
On the subject of the stratosphere and current modelling - both GFS and ECM take the 10 - 30mb stratosphere temperatures down to -80C in our vicinity in roughly eight to ten days time. There may be another opportunity to see the beautiful Nacreous clouds that we saw in early February of last year.
http://www.metoffice.gov.uk/learning/learn-about-the-weather/clouds/nacreous
ECM current
to this GFS 10mb
Last year, early Feb chart.
Not a certainty but certainly possible.
-
10
-
1 hour ago, Jonan92 said:
What a strange map, I have never seen such a thing
It's good to have a look at what NOAA see as Z500 upstream analogues in a situation like this. Images based on current 18Z GFS.
http://www.cpc.ncep.noaa.gov/products/predictions/short_range/tools/model_guidance.php?dayin=8
Day 8
Day 11There are some years with low February CET and some not - there are a variety of paths this can take and if a SSW materialises who knows.
-
7
-
-
Thank you all for sharing lovely snowy pictures - why could it not have done that when I was home at Christmas? Horizontal rain just does not set the scene.
-
5
-
-
Nice satellite image of the three storm systems.
-
1
-
-
10 minutes ago, Nick F said:
So you can see why there is this uncertainty, even only 6-7hrs out.
Horrible dilemma for forecasters this evening. Knowing what the roads are like at 6pm - this is not a good place for them. Latest AROME run.
It may not lie but driving through that with visibility problems, you can imagine accident potential.
-
7
-
-
I'm somewhat limited in weather nowcasting abilities but assume this is the AROME model depicting a squall line on the front edge and snowfall on the back edge.
Great satellite image of the system coming in - should be able to double click to get very fine detail if opened in a new tab.
-
7
-
-
23 minutes ago, Singularity said:
I agree it seems very strange on this occasion - as if they are looking at a different version of the ECM ensembles somehow!
Ian talked about no influence in the next twenty five days - perhaps, allowing lag time, they only see the amplification in phase 7-8 as being significant thereafter. IO is a high pressure set up over the BI, just more of the same as we are seeing. Different matter altogether with six/seven in the forecast.
@Tamara was talking about a February 2012 similarity - the MJO for the period - look at the amplification going into six/seven.
-
4
-
-
- Popular Post
The train of little troughs on the UKMO fax sheet, in embryonic stage.
Nice little comma cloud system in the frigid flow off Greenland.
Thank you, @Bring Back1962-63 for pointing out some may have no idea of what a comma cloud is. It is signature of mesoscale convection, allowed by very cold air aloft passing over warm seas below. These lttle convective commas are the signature of polar low development. Tiny, short lived, arctic 'hurricanes' with localised strong winds and copious quantities of snow.
A nice blog article from two scientists whose speciality it is.
https://polarlows.wordpress.com/tag/severe-weather/
-
18
-
Interesting to see the spread map for ECM at just +54 hours. Obviously relates to the precise track those little disturbances take.
-
5
-
-
12 minutes ago, Nick F said:
GFS showing sustained northerly winds of 40 to 50 mph and gusts of 70mph+down the North Sea, combine that with water bulge created by 974mb low and morning spring tide, could be some spectacular waves and coastal flooding for eastern England. Surge could be worse for Belgium and Holland maybe?
Yes, it's looking a bit rough down the North Sea on Friday.
-
4
-
-
- Popular Post
5 minutes ago, radiohead said:12Z ECM follows the 12Z HIRLAM, shows that little low embedded in the flow at 48 hours...
I saved this from the EC ensemble means run a few days ago as was intrigued by what the little red dot of uncertainty represented - just on the west coast of Ireland and the little kink coming in behind.
-
10
-
8 minutes ago, nick sussex said:
Thanks Tamara
I was trying to think back to a similar type scenario. OMG now I feel even older if that was 2012, the years are flying by! That spell saw some incredibly cold air down here, even further north in Bordeaux parts of the river started freezing over.
Yes, I see the similarity too ... why I've been looking out the thermals.
Heavy snow followed by a two week freeze and -17C overnight as the coldest. It's great but our house is not well enough insulated for that on a prolonged basis.
-
8
-
-
- Popular Post
52 minutes ago, Nick F said:All this talk of easterlies this morning and it's the 30th anniversary in a few days of the start of the infamous January 1987 beasterly, the Holy Grail of easterlies. The 13th of Jan '87 saw sub -15C T850s spread from the east. Only seems like yesterday I was helping to dig through a snow drift in Kent, aged 11, with my father so we could get our car back home.
My word, I can see why you needed to do so much digging. Some of those historic events now have a little more detail and time stamps from the ECM ERA charts available on Meteociel.
Jan '87 ppn/snowfall ...
-
17
-
- Popular Post
22 minutes ago, Jason M said:The GEFS are best summed up by saying 'close but no cigar'.
A couple of good runs in there but a bit meh overall. GEFS have moved firmly away from an Atlantic solution and now suggest pretty much what ECM was hinting at yesterday i.e. cool continental drift. A full on easterly is still odds against albeit those odds have narrowed somewhat today.
Beware the.....................
-
10
-
7 minutes ago, radiohead said:
There's an awful lot of snow for NW Scotland in that flow eg. 84 hours - sorry no snow charts for further south.
-
5
-
-
- Popular Post
15 minutes ago, bobbydog said:Come on Europe,
Send that cold over here....
I'm trying ....honestly ... you're welcome to it.
Eeeek!!! ... that's -14C over most of the department.
-
10
-
44 minutes ago, johnholmes said:
Sorry but that is not correct, one can see Cheshire Gap, Thames streamers etc in the right conditions. Forecasting thunderstorms on a national basis, ie larger scale model is also done routinely with UK Met. I am sure someone will come along and give a better insight into my comment.
Yes, John, we have that capability now but the model is not always right in the starting conditions or the evolution. The Arome 1,3 kilometre is a good example as will be the UKV (we don't get to see the output from that).
Zoom.
Wider view, you can barely see the wintry ppn on the mountain tops.
The slightly lower- res ARPEGE seeing the Gap.
-
5
-


 '60
'60
 '71
'71 


 '06
'06 
 '13
'13 
 '68
'68 


 to this


 Day 11


Model Moans, Ramps and Banter
in Forecast Model Discussion
Posted
The anomalies are not fickle - it is the understanding of the climatology they are set against. Most (all) of the models will base their anomaly calculation on the 1981 - 2010 climatology base - we need to refer to what that is in order to make correct judgements and, most importantly, remember that an anomaly does not represent actual contours.
Local European climatology for Z500 - base '81 - '10.
Height anomalies in the Scandinavian sector would need to be much greater than that seen on most of the recent modelling - in order to represent the type of high needed for advecting cold to the UK as a whole.