


Nouska
-
Posts
1,331 -
Joined
-
Days Won
4
Content Type
Forums
Blogs
Gallery
Events
Learn About Weather and Meteorology
Community guides
Posts posted by Nouska
-
-
- Popular Post
- Popular Post
25 minutes ago, oasis said:Though some may disagree, if the russian high can cling on a little bit, warm 850s can get pushed into the arctic, then that can be a trigger for the wave 2 action, as mentioned by GP in strat thread. Hopefully such wave 2 action could push back against the downward propagation of insanely high zonal winds. Also of note Anthony Masiello on twitter mentioned that we're in a - EPO state? Which apparently couples well with wave 2 action when it comes to impacts. Seeing the insane push of "green" 850s into the arctic could lead to colder impacts down the line.
Edit: The more directly that warm air can go into the arctic, the less the siberian cold pool will be pushed back - I think.
For anybody not sure what a negative EPO ridge is, an illustration.

https://www.theweathernetwork.com/news/articles/epo-what-you-need-to-know/43796/0
Similar to the PNA pattern but more focus on the EPAC rather than CONUS.
Add a strong wave2 from Eurasia and the vortex is squeezed down over us - in theory.
In practice - a good example December 2010.
-
 15
15
-
2 hours ago, Ravelin said:
Since it's 'quiet time' between models runs I have a question. On the GFS ensembles graphs, the bit at the bottom "risk of snow" with the pretty snowflakes, just how is it calculated? A percentage of the ensembles at that time who have precipitation at the location and a suitable 850s temp?
Why don't you pm @SylvainTV - he visits regularly and would clarify for you. I know the percentages are reflective of the ensemble probability section but not how they are derived so interested in the answer too.
http://www.meteociel.fr/modeles/gefs_cartes.php?ech=6&code=0&mode=26&carte=&proba=1
-
3
-
-
4 minutes ago, sawan said:
Guys I am really struggling to follow here
. I value all the senior (more knowledgeable) members , no criticism on anyone, I have read a few pages from earlier today and guess what I am confused now . Who should be followed? Got no clue. On top of that we have already started a blame game. Please keep posting and sharing and also consider the junior (less knowledgeable) members like myself and many more on here . Thanks. you have lots of company in the confused corner - including the Met Office boffins!
The only blame to be apportioned should be on not looking across a wider spectrum of model output - a lot did not concur with the idea of a blocked pattern conducive to the cold and snow so many desire. This is maybe the fault of some not understanding the climatology the anomalies are set against or just assuming northern blocking to the north west was an automatic cold signal.
We'll no doubt, in time, have a forensic assessment of where things went wrong for this month but failure is part of the advancement process and maybe lead to better forecasts somewhere in the future. Nick and Tamara are both right in their critique - too many butterflies fluttering all over the globe but Tamara does do a great job as our resident lepidopterist.
-
9
-
-
14 minutes ago, fergieweather said:
Yes, but it's the evolution on into January that is a focal point of ongoing interest (certainly at Exeter), with GloSea5 continuing each run to support Monday's ECMWF theme of migrating height anomalies westwards during week1-2 of Jan, with lows tracking much further north over this. The net result is a generally blocked output 1st half Jan, with switch from mean SW or at times perhaps NW flow (Xmas period) to E'ly into Jan and resultant higher likelihood of colder outbreaks. Confidence is of course very low at this lead time and not least - as UKMO point out - hindered by a lack of clear global teleconnections into that period.
That's interesting because the JMA has done a fairly quick change between the output on the eighth of the month to that of the twelth. Albeit, one is weekly and the other is monthly the indication was more of the same for first two weeks of January.
Latest seasonal for January 'might' depict what you are seeing in your models?
At least, it is the first indication of low height anomaly to the south - an artefact of the digging trough leaving residual cut-off troughiness in the westerns Med?
http://ds.data.jma.go.jp/gmd/tcc/tcc/products/model/map/4mE/map1/zpcmap.php
-
4
-
-
2 hours ago, snowwman said:
And we didn't have a weak (or strong) 10hPa vortex that winter, before the very cold February 1986.
Frequent and strong wave attacks though and a very distorted shape for a lot of the time.
Mouseover format for January and February 1986.
ERA interim data on Meteociel.
-
3
-
-
1 minute ago, feb1991blizzard said:
I actually think it is a good model GENERALLY and it looks like its cottoned on to the non-Northern blocking till mid Jan signal, I just think that those charts make a mockery and don't do the Met Office any favours, when Ian Fergusson describes them they always sound different, Ian's disclosure of the data has been pretty accurate as to whats happened over the last few years, I either think they should release the whole data set or non at all as I think the maps in that format are useless but very much believe the model is useful when used properly.
Precisely!
They run it regularly but we see a snapshot in time which is frozen for a month. As CS says, we need to update our understanding with the weekly products to get the evolving picture.
-
8
-
-
23 minutes ago, Ravelin said:
It'd be quite incredible if that turned out to be true, surely?
Now I know that it wouldn't preclude rain, even in an overall blocked scenario, but since most of our water reservoirs are filled up by rainfall in the winter months the term "water shortages" might become quite prevalent come summer.
That would certainly be a dire situation down here if projection becomes reality.
How did it perform for last JFM .....
GloSea forecast.
Reanalysis
-
3
-
-
1 hour ago, Tamara said:
Indecision related to tropical convection persists related to "destructive" signal of further cyclone activity in the I/O - which continues to interfere with the low frequency (amplification) signal over Indonesia. Additionally there is now a watch in place for significant tropical cyclonic activity in the Western Pacific (a good thing)
Good summary.
One of the other useful functions of the site that gives the UKMO 168 chart is the ability to 'quick look' at tropical cyclone genesis forecasts in the other basins.
http://ruc.noaa.gov/hfip/tcgen/
In this case, option NIO (northern Indian Ocean) and use the loop function to compare all the listed models day 1-7.
It looks to me that the MJO forecast from some models is following the projected path of Vardah - being it is the strongest signal at present but if something else develops further east who knows. Perhaps ECM is correct in not being misled by a short lifespan cyclone?
-
5
-
-
33 minutes ago, mountain shadow said:
That doesn't show an extensive HLB though, but a MLB around the UK. As ever we need HLB anomalies off the scale to bring snow to these islands.
Why would one even consider seasonal modelling programs as being a tool for forecasting conditions for snow?
The most powerful mesoscale models struggle at lead times of twenty four hours.
16 minutes ago, Ben Lewis said:I assume that comment is meant as all rounder from both sides.
As a learner/less knowledgeable member maybe it is how the brain interprets the information - the exact same can be said for those members who post detailed long winded reports on the computers.
You only need to spend time in the model thread to witness how the same chart can be interpreted in so many different ways. It all depends on seeing confirmation (or not) of personal preference bias.
-
6
-
-
- Popular Post
- Popular Post
13 hours ago, ditch said:IDO and Knocker will be right more than 90% of the time and you can't blame them for ramping mild, it's the default setting for the uk. What gets my goat is the computers and the so called professionalls that report a high possibility of northern blocking and cold when in reality it just does not happen. I'm a coldie and wish for cold and snowy weather but get so fed up with having to pay taxes to an organisation that lets be honest, for all the millions spent on super computers cannot predict further than 5 days ahead!! ! Rant over and sorry if I have offended.
I think you are confusing impartial realism for ramping - after all, by your own admission, it is the default setting in a maritime climate.
As for the bit in bold about extensive blocking not materialising so far .....
That image seems to agree with the supercomputers - don't you think - it is the December anomaly to date.
Maybe the problem is not with the computers but the brains that interpret the information.
-
10
-
1 minute ago, Steve Murr said:
I dont know this link - hence the initial mistake
S
Here's the link.
http://acdb-ext.gsfc.nasa.gov/Data_services/Current/seasonal_strat/seasonal_strat.html
-
6
-
-
Just looking through Levi Cowan's site at his analogues based on the November pattern - some nice winters in there for cold lovers and does validate some of the MO comment about seeing shades of '62.
A lost opportunity or a sign of what may still be?
-
4
-
-
35 minutes ago, blizzard81 said:
Would be interesting to look at Jan 87, late Dec/Jan 78/79, Dec 81. Were these famous cold spells preceded by ssw's?
http://ds.data.jma.go.jp/gmd/tcc/tcc/products/clisys/figures/db_hist_pen_tcc.html
You'll get historic strat charts for 30mb at the above link. Also offers 100mb, 500mb and sea level which allows you to follow the downward propagation. It's set for five day sections but you can change to ten days or more.
Edit - as Steve says below it is the angle and shape which is important - my link has the geopotential heights shown rather than the degree of warming.
-
2
-
-
34 minutes ago, blizzard81 said:
Glosea has been shown to be an exceptional long range forecasting tool over the last few years. Far superior to ecm.
There are some charts of the GloSea5 strat modelling for the winter of 15/16 in the PDF for presentation to MedCOF5.
Pages ten and eleven.
http://medcof.aemet.es/images/doc_events/medcof5/docMedcof5/presentaciones/MedCOF5_Brookshaw.pdf
I don't think they did a presentation for this winter at the most recent conference.
-
3
-
-
4 minutes ago, Mucka said:
What can we do when almost the entire GFS suit flip flops from blocked to mobile run to run?
The 00z was possibly the strongest signal yet for blocking Christmas week and then the 06 comes along and could be among the weakest.
I can certainly see where the MetO forecast is coming from though, high to the East and trough to the West but no undercut/low heights into Europe, so no real snow prospects. That has been the pattern for December, plenty of promise but all unrealised.
No doubt the 12z set will be much keener on building heights North and blocking again in FI. All very frustrating tbh.
If I had to take a wild stab at Christmas weather I would say temps around average in the North, perhaps a little below in the SE, mostly dry.
If you look at the last ECM46 ensemble mean chart (Christmas week) for 500-1000 thickness - you can see why models are having such difficulties in solution. Such a narrow corridor between quite extreme thickness values and just tiny oscillations in the pattern give very different outcomes as surface conditions.
It could be some time before this is resolved.
-
8
-
-
16 minutes ago, Carl46Wrexham said:
If it's 7c outside the last thing on my mind is "shall we do a barbecue"? My missus would punch me if I made that kind of suggestion in December at such temperatures and rightly so.
LOL, that reminds me of living in Canada - the strange sight of the hubby outside, dressed in parka and salopettes, tending the BBQ while wife and kids indoors, all cosy, awaiting the delicious feast being prepared for them.
Nope, I'll be in Surrey - no BBQs there - look at the theta E and any ideas of that should be quickly dismissed.
-
7
-
-
This is the FIM forecast so will be a bit different in the modelling of the strat to the one a couple of posts up. Note the difference in the wind speed between 10mb and 25mb. Shame there are no more layers to look at but it could be useful to monitor whether the very high speed winds are propagating down.
10mb
25mb http://fim.noaa.gov/FIM/Welcome.cgi?dsKey=fim_jet&domain=201&run_time=08+Dec+2016+-+12Z
-
5
-
-
24 minutes ago, bluearmy said:
Not sure why the SSW musings have gained traction
currently there is evidence that both ec seasonal and glosea are both seeing the upper strat zonal wind increase back up to usual levels for mid dec onwards and yet they both predict high height anomalies to our north through jan and in the case of ec, feb and march aswell. so why the disconnect predicted between strat and trop. this isn't a situation where we see a disconnect occur and then look back to see the reasons why. this is a predicted disconnect. anyone got any thoughts? we have seen strat/trop disconnects before. has the fact that we should be E QBO and yet we are W QBO got anything to do with it ??
I remember musing in the ENSO thread as to whether such a dramatic end to the winter vortex would leave a 'memory imprint' to see in the new winter season. This was also predicated on the QBO anomaly. I've no expertise in this field - just like to ponder some of my pattern knowledge, in another field, on to atmospheric behaviour. Probably mad, but there you go!
-
3
-
-
8 hours ago, Weather-history said:
Yet the tropospheric pattern, at least on our side of the northern hemisphere was not that impressive. Not compared to the eye popping synoptics of December 2010 and March 2013 or indeed mid December 2009-mid January 2010.
Much will depend on the positioning and whether it is tropospheric wave led or SSW downward propagation. Time delay plays a big part in looking at patterns at the surface.
Late November 2010 split.
tropospheric led
Mid January SSW 2013 split
Mid December 2009
tropospheric led.
An edit to say that the '09 and '10 wave patterns are, according to recent research, very typical of solar minimum/early ascent stage of solar cycle. Tendency for strong ridging through Greenland - Kamchatka route, connecting Atlantic to Pacific ridge and thus cross polar flow.
-
5
-
-
- Popular Post
- Popular Post
4 hours ago, blizzard81 said:I find the model output absolutely astonishing at the moment. The difference between yesterday's ecm 12z and this morning's 00z is nothing short of amazing. One of the biggest differences I have seen in 13 years of model watching.
I hope they have plenty of 'juice' in the DECIDER function - it is going to be getting a very thorough work out in the coming days - maybe even weeks.
The new monthly update due out tonight will have the same starting data as this last ECM run - does not bode well for a clearer path to beyond the Christmas period.
The late run modelling from ECM does reflect how it saw the week three period, as per last EC46. Deep, cold troughing exiting NE Canada but that was on a steep SE trajectory which allowed heights to build to our north. All a matter of how the big vortex cogs are expected to position from the starting data.
I suspect the models are having real difficulty in not having a coherent tropospheric PV and not being able to create a stable one.
-
11
-
On 07/12/2016 at 15:21, KyleHenry said:
That then dictates February to be the month for blocking to get a foothold.
Strong wave 2 required but at present it does NOT appear to have enough energy.
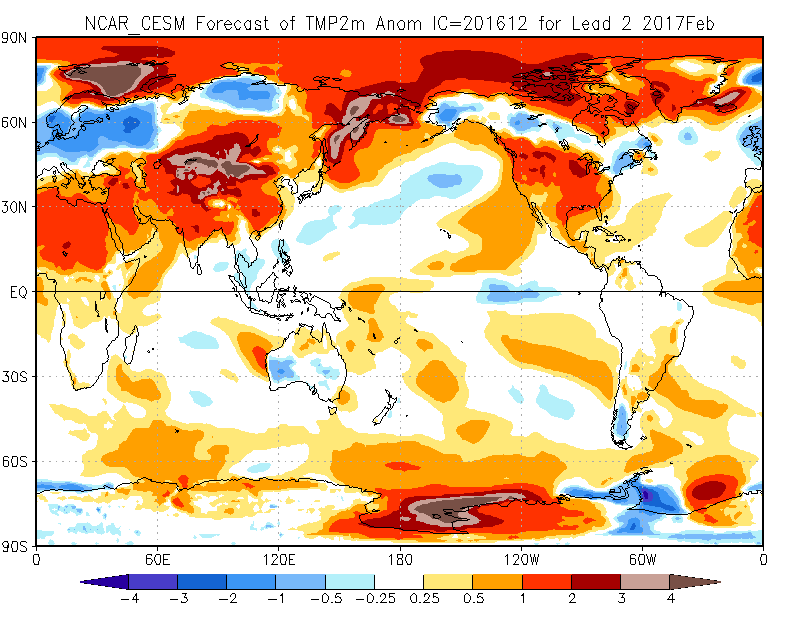
The one long range model I have been impressed by - NCAR CESM - had been consistently showing a very cool picture for February - blinked last month - now back again . I know it is ice anomaly coupled but no idea as to whether it has stratosphere forecasting abilities. This sees the October/November pattern re-establishing with the cold managing to penetrate as far as the UK.
This is the model that Dr Ventrice has been singing the praises of, from a USA point of view. A rare success in model terms for October too, Eurasia wise.
http://www.cesm.ucar.edu/about/
-
6
-
-
8 minutes ago, Nick F said:
The chart you posted on the left is up to 336hrs (week 2) and the right after 336hrs (week 3) though? Nevertheless week 3 does hint at a southerly tracking jet I guess ...
They both said +336 - my apologies. That would make more sense and better too as more ppn signal in the Med.
-
3
-
-
29 minutes ago, Nick F said:
Wrt to EC46 (weeklies), not completely out, but this is week 3 as a teaser ... H500 +anomalies to the NE this time
A very different picture on the ppn and 850 temp charts to previous runs. Unfortunately the axis seems to go way south and only brush the coasts - nothing penetrating far enough in for what people are looking for.
It is remarkable how two sites can present the precipitation anomaly for the 336 to 504 timeframe so differently.
-
3
-
-
- Popular Post
- Popular Post
17 minutes ago, Ali1977 said:Even by day 9 the majority of ENS have high pressure ridging back into the UK - could we be about to see a swing back to a dryer cold set up I wonder.
Infact by day 10 things are really looking up.
I think the parallel run is probably more representative of those members.
Parallel run only available in the archive back to third day of December but good continuity in this blocked scenario for pre Christmas week.
Last four runs with most recent first. GIF for the latest run.
GIF 06Z -
10


 . I value all the senior (more knowledgeable) members
  , no criticism on anyone, I have read a few pages from earlier today and guess what I am confused now
  . Who should be followed? Got no clue. On top of that we have already started a blame game. Please keep posting and sharing and also consider the junior (less knowledgeable) members like myself and many more on here . Thanks.
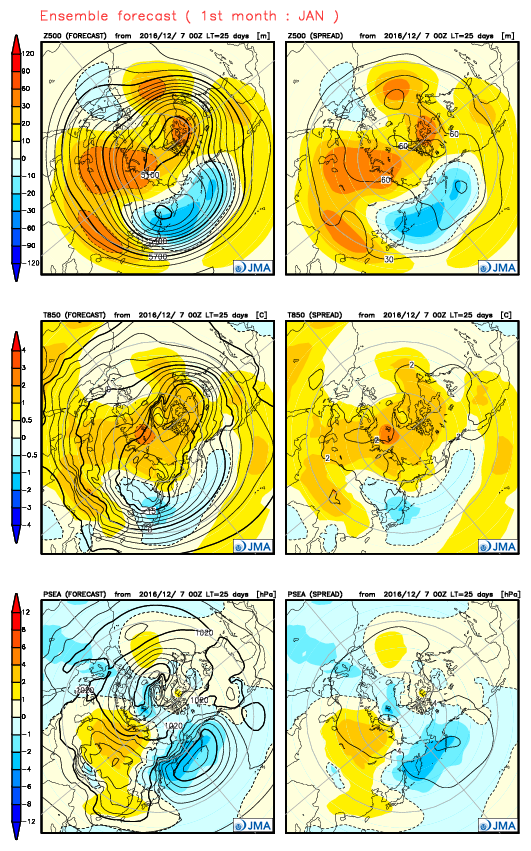


 25mb
25mb 


 tropospheric led

 tropospheric led.


 GIF 06Z
Model output discussion - 5th December 2016 - Into Winter we go
in Forecast Model Discussion
Posted
There is a very cold pool of upper air modelled to traverse central UK on Saturday - cold enough to support polar low development but I don't know if all other parameters would be favourable.
If current modelling looks to verify, please make sure you factor in the possibility of power outages when planning the festivities and feasting for next weekend.
