
- Popular Post


Nouska
-
Posts
1,331 -
Joined
-
Days Won
4
Content Type
Forums
Blogs
Gallery
Events
Learn About Weather and Meteorology
Community guides
Posts posted by Nouska
-
-
- Popular Post
1 hour ago, IDO said:If you believe that -15c Dew points are close to verifying, then I don't know what i can say! March 2013 was the previous time, -17c. The chart for that day very different:
I don't know how you can say that as the dewpoint was -15C not so very far from Holland, overnight Saturday. It is an extremely cold and dry airmass just to the east and should the flow change, it is certainly not beyond the realms of possibility.
Mid day yesterday after some of the cold air had been pushed back east.

No great leap of faith to envisage the mass moving west or south west with an easterly drift.
Leuven (central Belgium) ensemble from ECM - that's cold for there!
I'm taking note of the forecast for down here anyway - just on the edge of the -12C isotherm.
Just to add the day nine Mean SLP chart from ECM.
Perhaps more likelihood of the cold travelling south west rather than directly west but nothing there to say the det run is an impossibility.
-
 13
13
-
22 minutes ago, ArHu3 said:
I don't think I have ever seen such narrow bandwidth for so far into the future before
Quite a bit colder in the SE of Holland too. I'm wondering how far south and west this can go - maybe all the way down here given the suggested longevity in the ensemble.
-
2
-
-
12 minutes ago, Froze were the Days said:
Sorry...not sure if anybody else has mentioned this since the 12z ECM came out but does the 216-240z transition of the HP to Scandanavia look fesible?...I've seen many a winter chart over the years but not a HP from a few hundred miles off the Portugal coast to where it is at 240z. I'm not buying that.
The ECM jet stream charts for last few days of the run - evolution suspect?
Perhaps but we have seen very sudden amplification before and it is a pattern that has been well trailed in the EC46 products.
-
4
-
-
- Popular Post
There's plenty of ppn moving through with the -5C isotherm.
...and lots of interesting little disturbances in the flow when you run the 240 hour animation at 6 hourly time steps.
-
20
-
1 hour ago, Bring Back1962-63 said:
Perhaps someone else might like to check back on the historic charts and post them up for a comparison to the ones above. I think I have the dates right (definitely for the middle event). My memory is better at recalling those historic events compared to very recent events (practically none, I know). If these features materialise they can pop up quite suddenly (perhaps with less than 72 hours notice) and even during predominantly mild Winters.
Your memory is spot on - here's the three dates in mouse over format.
Other parameters available in dropdown menu.
Edit for @Bring Back1962-63
The thread on here about the last one.
..... and a January 2010 event study.
-
3
-
-
23 minutes ago, knocker said:
You weren't casting your eyes on this little fella by any chance ?
Nope.
The ECM did actually get one at four days out - you might remember? The mets were a bit at odds about it though.
Satellite and a beady eye nearer the time if upper air profile still the same.
PS - you can tell I'm missing the tropical season.
-
3
-
-
- Popular Post
11 minutes ago, Seasonality said:Is it not quite rare for them to get so far south and I think they weaken rapidly over land? Still, they are very difficult to model and chances are that one wouldn't appear in the NWP and would require nowcasting using satellite images.
There was a beautiful example hit Brest a few years back and some of the most spectacular ones have travelled a long way down the North sea with huge snowfall as they landed. I'll be trawling the close-up satellite pictures from the IMO site if it turns out anything like modelled.
The most recent one was a bit questionable as it started life as a baroclinic leaf to the east of Iceland - didn't really matter as it did the convective thing on its travels south and crossed central/southern England with a good amount of snow to please the chionomaniacs amongst us.
-
14
-
- Popular Post
7 minutes ago, frosty ground said:GFS shows a very Unstable flow from the North West turning to a more Northerly.
Surely this cold an upper air mass could give a chance of polar low formation. It's originating over Greenland and following some of the favoured routes as in the papers linked by Knocker and John Holmes.
Of course, we have to get it to verify but I'm more confident than usual, having looked at the finer detail for the ECM model on the Icelandic site. Both bring this in but there are issues with timing and no doubt shortwaves once we get to five days out.
The EPS 00Z T850 mean +192 at circa -8C is nothing to be sniffed at.
-
12
-
19 minutes ago, feb1991blizzard said:
Always when that slight uptick in the ECM London graph occurs when we are in the middle of a will it / wont it cold snap question mark, that the first one where the graph starts to rise, even if its small and at the end, usually signals a flat Jet SWerly pattern and starts to gather momentum from there, it always happens, hope not this time.
You are being swayed by the uptick in the GFS deterministic 12Z run (blue line). ECM has a bit more scatter but the grouping is actually colder than the previous run. The ECM suite mean (yellow line) is still solidly on or below 5C for max temps, mid month on, as it was on the 00Z.
-
7
-
-
- Popular Post
15 minutes ago, mountain shadow said:Where's that from Dennis?
Since nobody has actually provided the link, here it is and one I use a lot, especially analogue section.
http://www.cpc.ncep.noaa.gov/products/predictions/short_range/tools/model_guidance.php?dayin=11
The chart Dennis showed is the GEFS 06Z run from yesterday - bottom section with 700mb analysis.
-
11
-
29 minutes ago, chrisbell-nottheweatherman said:
+12 - +13C anomalies - would surface temperatures be anything like as anomalously high, I wonder?
An atmosphere cross section (+186 hours) for southern Ireland, where T850 temperature anomalies are greatest.
As there is no change from 850 to surface, a bit above seasonal norms perhaps.
http://www.meteociel.fr/modeles/coupes_gfs.php
-
4
-
-
Week 3 anomaly from the ECM monthly.
Z500
T850 A glimpse of the 360 hour ECM Z500 means from the 12Z run shows this picture.
Bearing in mind that the EC46 is from the 00Z run, good continuity in the contours on the 360 chart to see the pattern extend beyond.
@Man With Beard - yes, bad showing so far this winter but can a good model keep doing this badly right through? First proper rain down here, showing in the French model app, days nine and ten so high pressure looks to be waning to some extent.
-
4
-
-
Once again the the NCAR CESM was the best of a poor performance by the N.American long rangers. EUROSIP poor too, in there under the banner of IMME. Unfortunately, all were right for the UK in seeing varying degrees of positive temp anomaly.
December 2016 surface temperature reanalysis.
DEC CESM forecast The model suite forecast for December 2016.
http://www.cpc.ncep.noaa.gov/products/NMME/archive/2016110800/current/tmp2m_Lead1.html
-
1
-
-
- Popular Post
17 minutes ago, MR EXTREMES said:please dont take offence but them 50% are all dream charts that are not supported by atmospheric background conditions.
That's an interesting hypothesis.
Unless the perturbation tweakings are including modifications for background signals that do not actually exist then the solution of the run should reflect the possible atmosphere physics. I've understood it to be a range of outcomes should x,y or z come to pass but all within the parameters of existing starting conditions.
Maybe somebody can clarify if my understanding is incorrect and the ensemble members starting conditions are just plucked out of thin air.
-
25
-
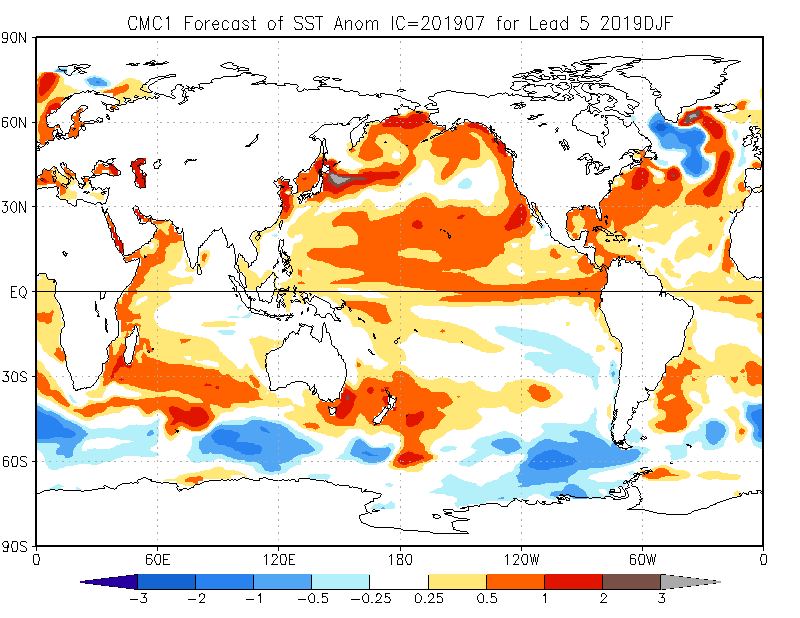
As a western European, I would be more concerned about what CMC/Cansips is showing for the Atlantic.
Fortunately it seems to be out on its own with that but most other models of the north American set agree on a warm neutral/ weak Nino for summer.
http://www.cpc.ncep.noaa.gov/products/NMME/current/tmpsfc_Seas5.html
-
4
-
-
- Popular Post
Wishing my weather community friends a very good New Year.
GFS decides to kick 2017 off in style - a swift canter through most of the DECIDER weather regimes one could expect over the course of the year.
http://www.metoffice.gov.uk/research/news/2016/new-weather-patterns-for-uk-and-europe
It'll get the right one for us soon - have the faith.
-
17
-
1 minute ago, radiohead said:
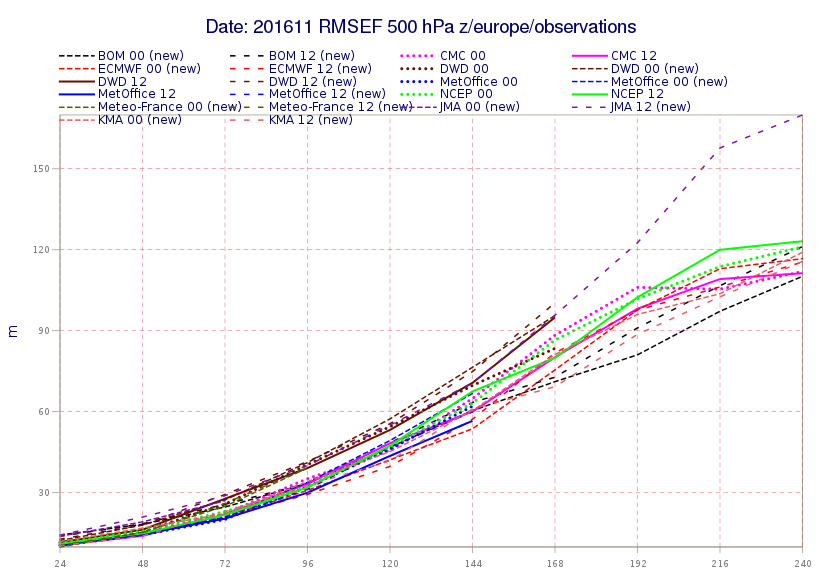
Very interesting. Am I reading that right, DWD is best out to T168? Or worst?
Lowest is best in this instance. BOM and KMA were the top two.
-
2
-
-
26 minutes ago, radiohead said:
It's time to roll out that model we all know and love, the 12Z CPTEC BAM
Whilst on the subject of lesser models, it might surprise some to know the best verifying models for the European Z500 sector, day seven to ten, in the month of November.
http://apps.ecmwf.int/wmolcdnv/scores/mean/500_z
For avoidance of confusion, lowest score is best in RMSEF = 'Root Mean Squared Error of Forecast'.
-
8
-
-
After being swayed by long range material for December, back to usual methods to start the year. CET range indicated 2,5 to 4,0C so I'll play the top range* and opt for the median of the punts.
3,9C please.
* To take cognisance of recent warming when comparing to decades past.
-
1
-
-
15 minutes ago, karlos1983 said:
I think it's probably a safe bet to say that this op will sit on the mild side off the ensembles.
Unless a new signal has been picked up six hours on, it looks a bit out of kilter with the 00Z ECM. Mean has good agreement with the deterministic (hatched lines) at 156 hours.
Both options are cold so nothing to be gleaned from Tweets stating "colder next weekend" - the saga will run a bit yet - in the meantime, have a good evening of festivities and apart from the heads
it might all be clearer tomorrow.-
5
-
-
7 minutes ago, Iceberg said:
Well 18z has gone from southerlies. Back to cold nw and then northerlies. We've seen this before where the models suddenly over react to a signal only the cancel out the reaction again over the next few runs.
Not saying yet that this is happening but it's possible
The more detailed ensemble mean on from the EPS also show the northerly next weekend is not off the menu just yet.
MSLP
T850 The people with access to Weatherbell might have more info but it all looks pretty cold right out to 360 hours on the latest run.
-
6
-
-
18 minutes ago, blizzard81 said:
Indeed. You wouldn't think it was the UK model would you? Seems more interested in the US. The UK hardly makes it into the map - ridiculous!
It is a tropical cyclone genesis view - NOAA and NHC don't focus on beasts from the east when hurricane forecasting, their interests are focused on ocean beasts.
-
6
-
-
- Popular Post
2 minutes ago, JOPRO said:What I meant was if you only go out to 144hrs you tend to do away with the 'garden path' situations we find oursleves in when looking at long range outputs for cold in winter or hot in summer.
You could always not click on anything beyond 144 if it troubles you so much - the garden path need not be trodden on, stick to the greener grass.
-
16
-
14 minutes ago, Steve Murr said:
Hi thats getting close to the magical sub >-40c@ 500HPA however the angle of flow is to westerly-
You need a flow off the greenland shelf ( or occasionally just west of norway ) as well as a steep gradient to get a decent polar low-
Best
S
Thanks Steve.
The in between on ECM - low well north of the GFS positioning but at least it shows some (in the far north) will wake up to fresh snow on Christmas day - even if it disappears by the time the turkey is on the table.
-
5
-


 T850
T850 

 DEC CESM forecast


 T850
T850 


Model Output Discussion 29th December - Into mid-Winter.
in Forecast Model Discussion
Posted
It cannot be very often you see probabilities shading for parts of the UK to be sub -8C at 850 level.
First from the north....
and then the continental influence shows its hand.