


Nouska
-
Posts
1,331 -
Joined
-
Days Won
4
Content Type
Forums
Blogs
Gallery
Events
Learn About Weather and Meteorology
Community guides
Posts posted by Nouska
-
-
11 hours ago, chrisbell-nottheweatherman said:
Malcolm - regarding the paper by Screen, I'm confused as to what he means by the following:
Do you think he means that the tropospheric response to the weakened PV is to initiate a response similar to a strongly +ve or -ve phase of the NAO? From my limited understanding of such matters, I'm aware that weakening of the stratospheric vortex which filters down to the troposhere tends to initiate a meridional jet which is characterised by some form of -ve NAO, whether east- or west-based, however, to my layman's mind, Screen's reference seems ambiguous. Apologies for the slightly O/T nature of this post - might I ask the moderators for some leniency given the more laid-bak and considered nature of this wonderful thread?
An earlier paper talks about autumn/early winter response being a negative NAO one - this new work is more region specific but maybe assume the NAO comment is as before?
http://www.cgd.ucar.edu/staff/cdeser/docs/screen.seaice_atm_impacts.jclim13.pdf
I do think it has a place in an in-depth model thread as long as we stick to the subject with reference to models and not the debate on causes. I'm sure we were seeing modelling difficulties last autumn due to the incredible temperature contrasts at high latitudes.
Edit to include another recent paper on the same subject.
http://centaur.reading.ac.uk/51159/1/jcli-d-15-0316%2E1.pdf
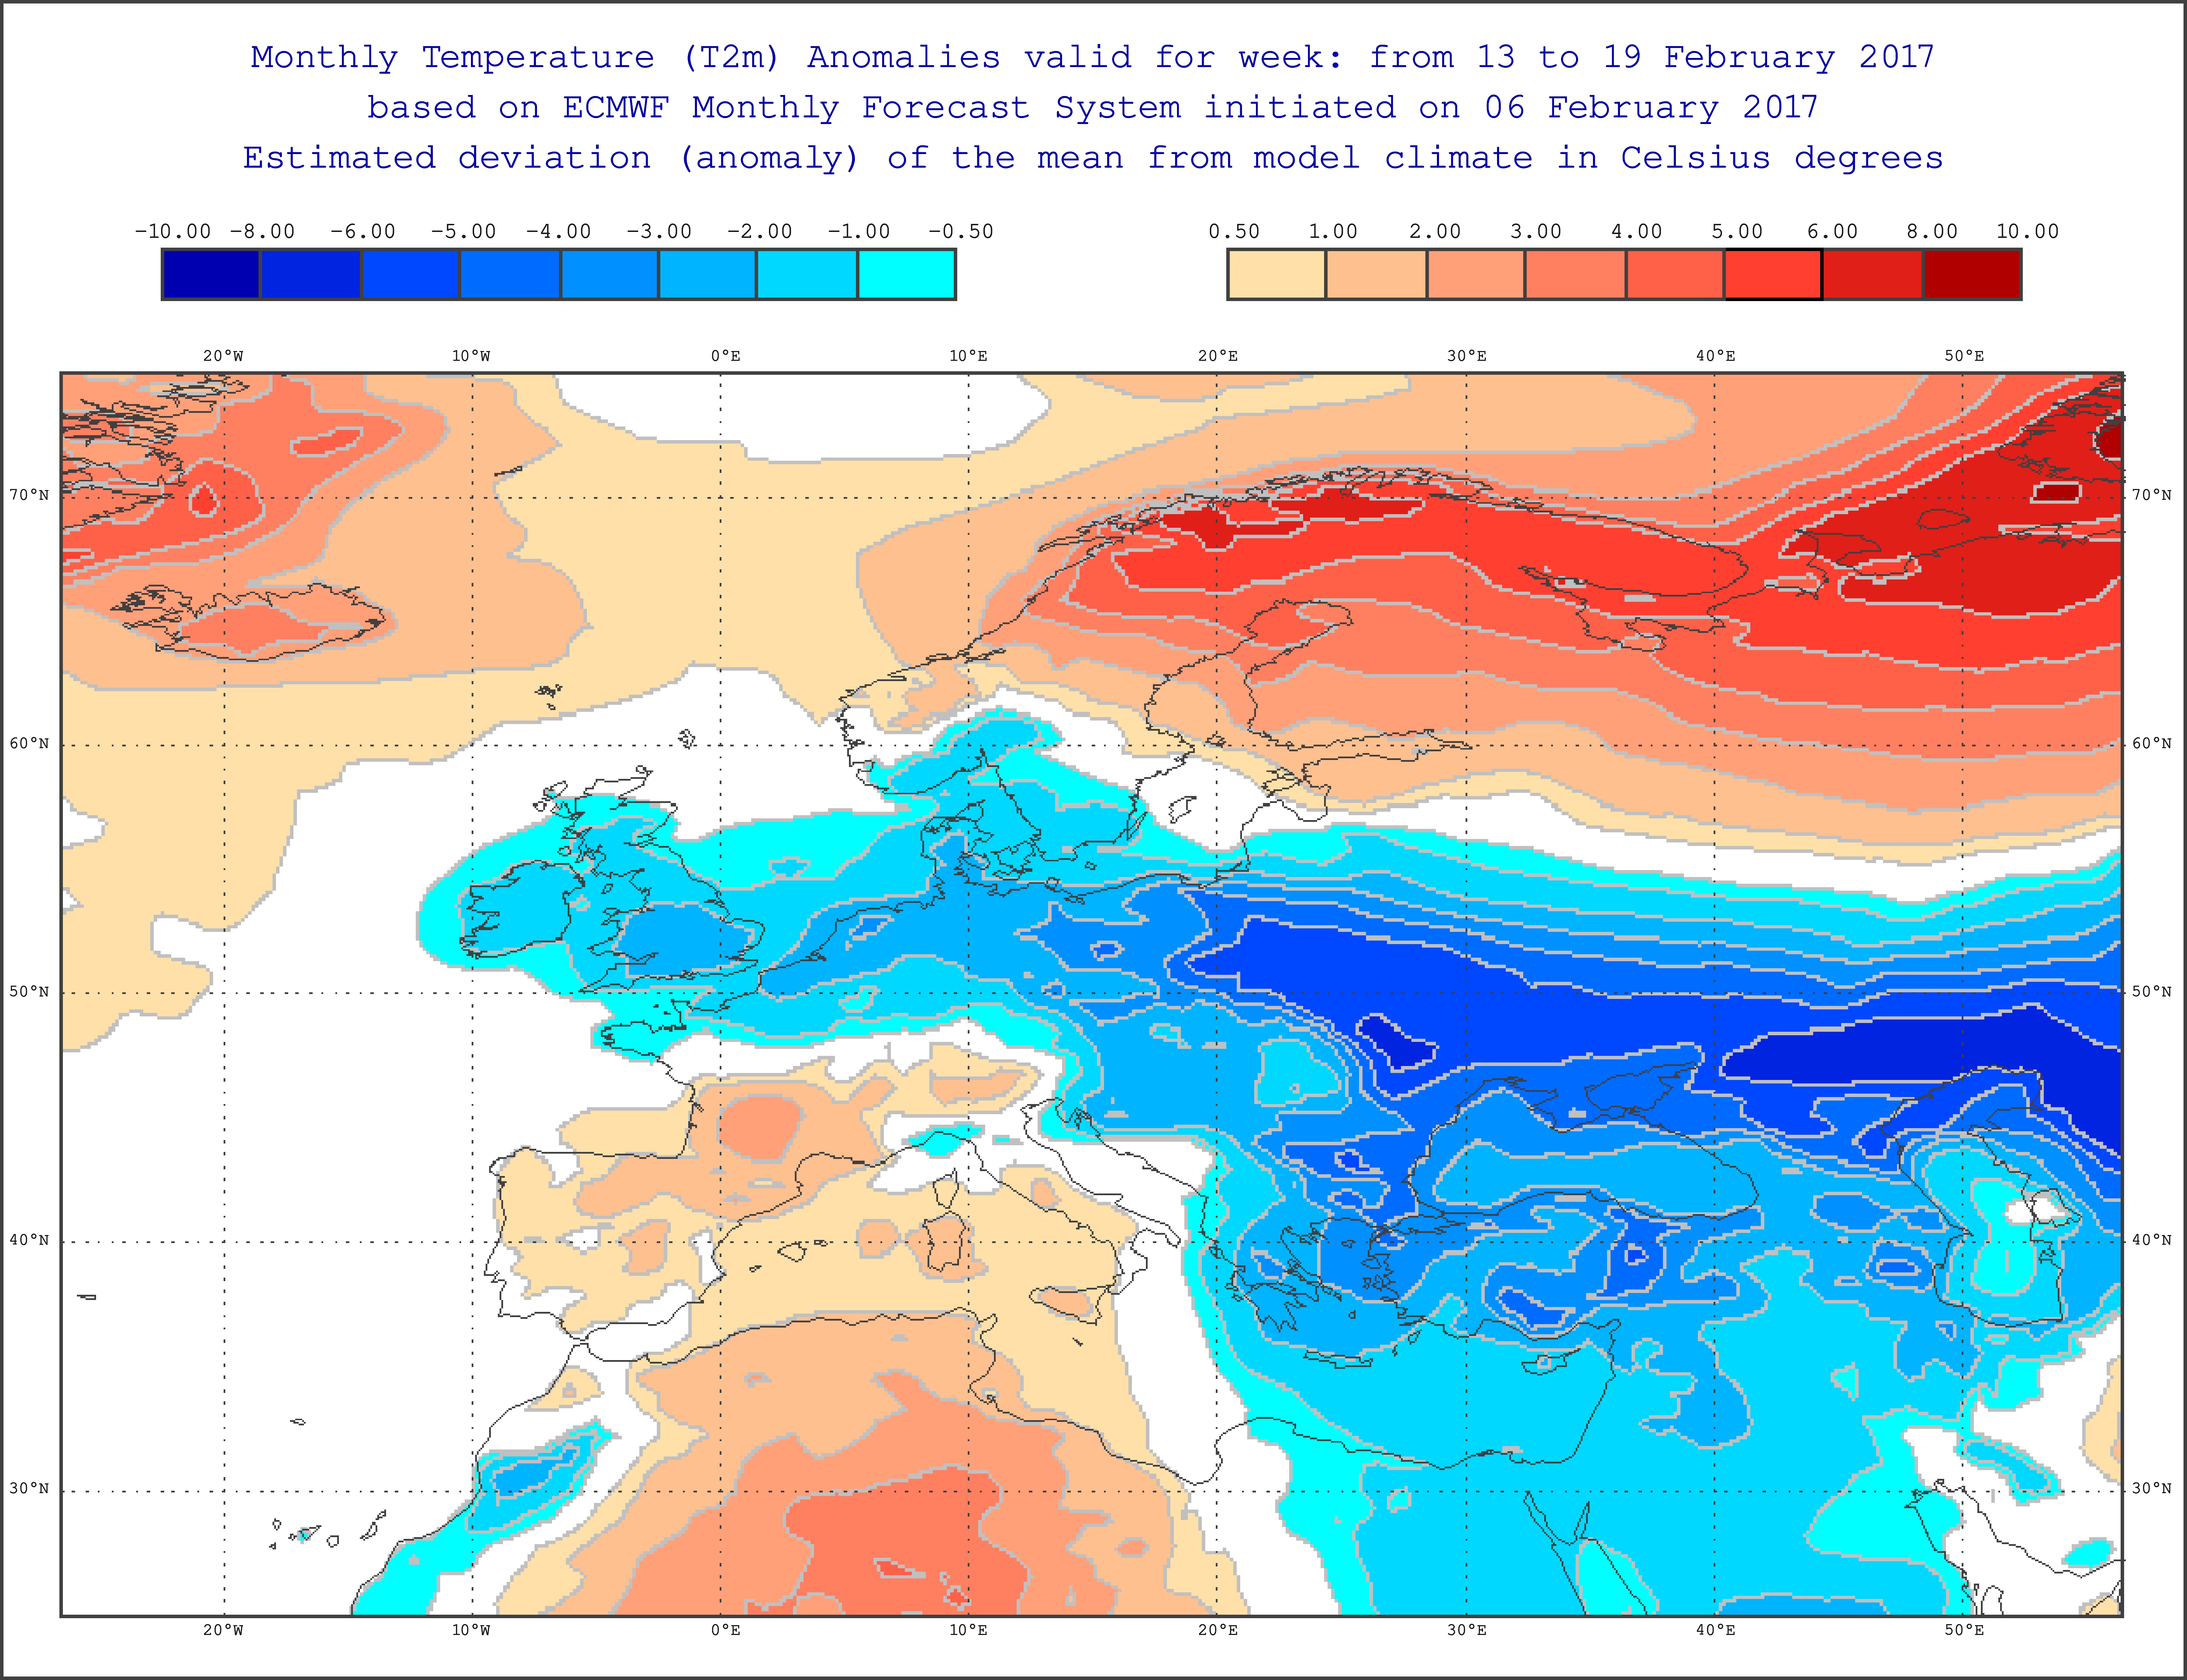
The model simulation in two monthly segments - showing the parameters we all look at in the NWP.

-
 4
4
-
-
I think people get carried away, thinking the SPV is gone, when looking at only the 10mb temperature plots. It is in a very healthy state currently....
Forecast is for another displacement episode at the end of the GFS run - almost an end of January redux ...
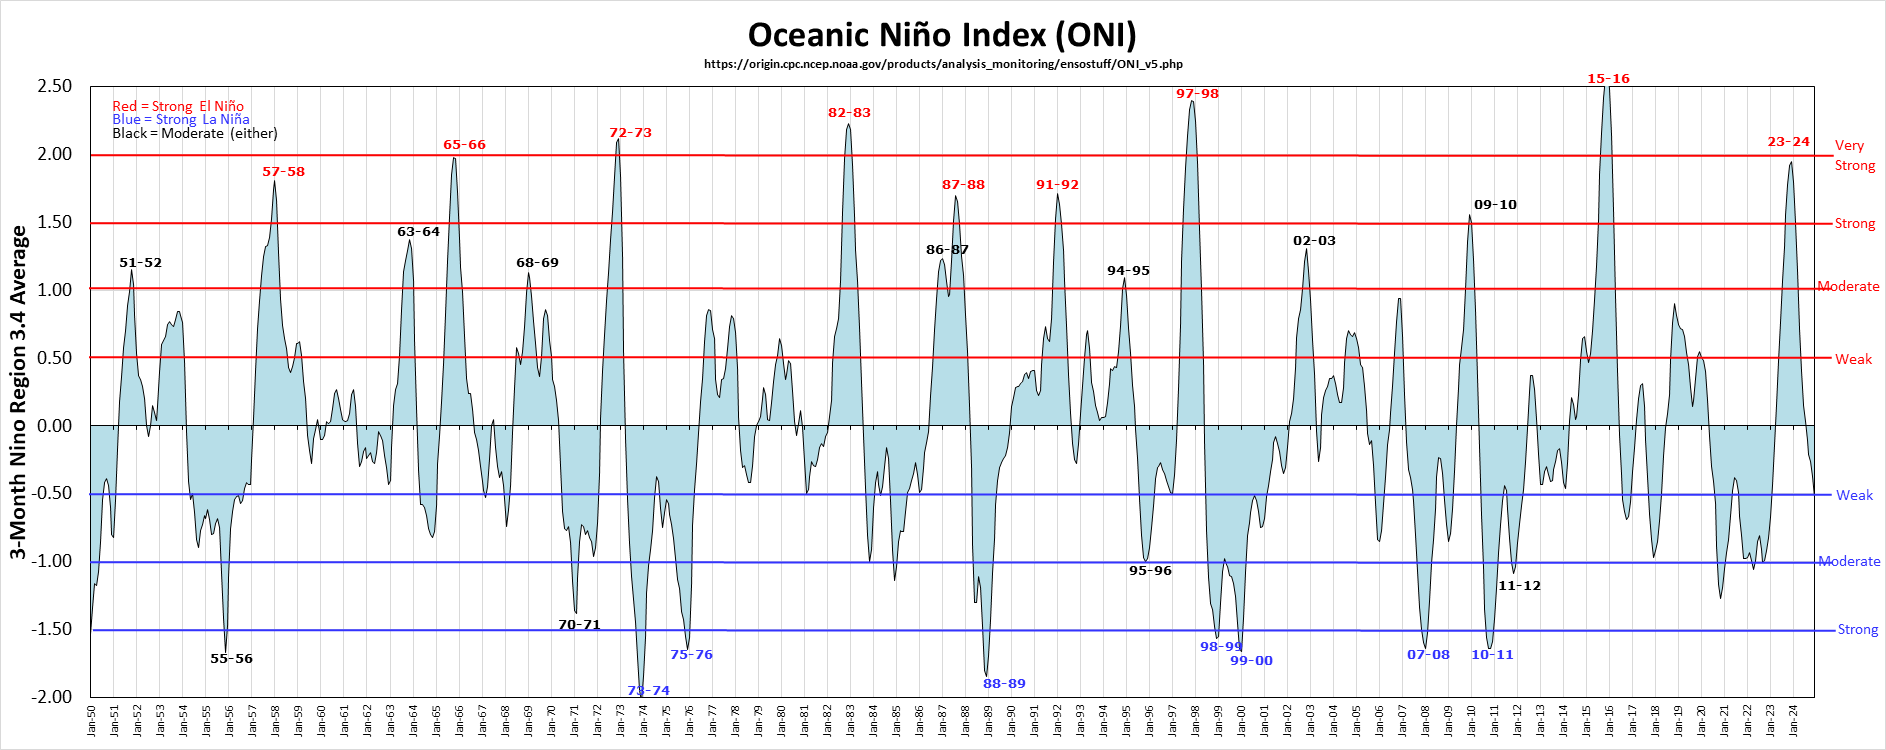
@Singularity - the papers/write ups you refer to are near the end of the previous stratosphere thread. One heavily pointed to a super Nino connection - another said that the signal was not of tropical origin, rather from mid latitude wave activity. I don't see any anomaly during the '97 -'98 progression.
-
4
-
-
1 hour ago, Froze were the Days said:
Yep totally agree, I've been keeping winter records since 1983 and take away a period 09-10, Dec 10 and periods 2012-13 the winters have been poor since the late 90's and certainly makes you wonder if this is GW now taking effect.
There is a Climate Science forum on here - crying out for some interesting debate from new contributors - this is not the place for it, but just regarding the part of your post I have highlighted.
http://www.clim-past-discuss.net/cp-2017-8/cp-2017-8.pdf
Low solar influence on European winter temps reanalysed over a 350 year time span - only 10% fit into that category!
There's no reason to suppose one of your good winters can not be replicated in the not too distant future since those occurred during and just after last minimum - another minimum fast approaching.
-
7
-
-
12 minutes ago, Man With Beard said:
Very good, who produced it?
UKMO and here's the actual sea level pressure to date.
They really pinpointed the centres of high pressure well but they had a mare in the Temp department for Eurasia.
-
3
-
-
34 minutes ago, Ali1977 said:
MJO and strat can't do it then maybe the key was the out of sync QBO - should have been Easterly not westerly!! Maybe a diff story if the other way round. We had great early Siberian snow cover too, another fail!!
Agree with the previous comments re QBO etc but have to take issue with your reference to the SAI.
It was a marker for European cold - spot on for this winter! The bulk of mainland Europe has had few mild episodes and some of the cold ones have been exceptional.
It is sad you were not able to share that but there is always next winter when the other pointers to cold may be robust enough to get it over the North sea.
Just to add - did anybody look at the post I made last night about an almost identical phase/timing of MJO in 1988 - the Greenland high did not materialise till two weeks after peak of phase 8.
-
8
-
-
1 hour ago, Matthew Wilson said:
Wouldn't be surprised to see it go neutral over summer.
We are nearly there at 10hPa
.... and slowly reducing below that level - bar upsets like last year, it should be east by the business end of the year.
http://www.geo.fu-berlin.de/met/ag/strat/produkte/qbo/singapore2016.dat
http://www.geo.fu-berlin.de/met/ag/strat/produkte/qbo/singapore2017.dat
Just to add the last four solar rotations - geomag remaining low but check out the years on the link below to see what it looked like during and after minimum in 2008 and 2009
-
6
-
-
22 minutes ago, johnholmes said:
Interesting how the upper air cross section has changed since yesterday for this area, see link for those with Extra. It does suggest cloud tops up to 10,000 ft or so for a time and with near zero C surface temperatures before the less cold air gets in. One would expect, if this is correct, that the Peak District, Yorkshire Moors and Lincolnshire Wolds would have a decent covering of snow. Less reliable for me at 30 feet AS.
I will do a check tomorrow, who knows it might be similar again, or then, maybe not!
Hi, John - a question.
I'm useless with all the criss cross lines on the skew T diagrams - prefer the cuts on Meteociel.
Today is just a flat strat picture but tomorrow shows plenty of lift to get convective cloud higher up and blown in. Is that just a matter of slightly colder temps aloft than today or some other ingredient?
Cut is from Lincolnshire out into N Sea.
http://www.meteociel.fr/modeles/coupes_arpege.php?region=uk&ech=3&mode=2
-
1
-
-
10 minutes ago, nick sussex said:
Thanks Nouska just caught up on your previous post and the new one, I'm sure your new one has gone down quite well looking at the composite! By the way can you do another composite factoring in the Indian Ocean Dipole? lol Just joking, thanks for doing those, really interesting. Talking of the IOD thats spiked in recent days moving out of negative territory which does help the MJO along.
Oh Nick, sheesh!
It's not an Indian Ocean Dipole - that's neutral currently. It is an IOBW (Indian Ocean Basin Wide) cool event. There's a different atmosphere response to that.... if you want to be driven mad or drive the readers to the drinks cabinet.
In the dropdown menu.
http://ds.data.jma.go.jp/gmd/tcc/tcc/products/climate/ENSO/month.html
-
3
-
-
59 minutes ago, mountain shadow said:
Im not sure the MJO was being written off, just that phase 8 of the MJO in February does not necessarily produce a Greenland High. Nouska posted some compisites earlier.
A bit more time now and have been able to look at month specifics - the 1988 event is probably the closest to what is anticipated in the forecast - the other years had different timing and little foibles of amplitude and direction.
Forecast.
Feb '88 The composites for February and March 1988.
The ERA reanalysis for 15th February onwards as it's interesting to see what weather patterns went with it.
Only part of the story and events in the stratosphere may completely change the picture anyway.
@nick sussex mostly solid Nina.
-
9
-
-
- Popular Post
- Popular Post
19 minutes ago, MattTarrant said:I was just wondering if anyone has the time to briefly outline why the MJO moving into phase 8 could promote greater amplification, or at least on a rough scale what impacts it has on the Northern Hemisphere atmospheric profile? I see people posting these MJO charts, but would like some explanation behind it please? I have tried doing some research in to it but I think it might require the summer when away from College to do that. Any response would be much welcomed
Very briefly as I'm not at home for all the desktop links. An animation of the 200 hPa stream function (jet stream level) of the different phases of the MJO. The little phase 'clock' (top right) shows the heights building over eastern Canada and Greenland as the 'hand' passes through phase 8 -1.
http://envam1.env.uea.ac.uk/mjo.html
That's a very rough interpretation as it is not a fixed entity - depends on season and amplitude as well as Kelvin waves and tropical cyclone activity.
-
15
-
Be careful when looking at composites for MJO phasing.
Joe Bastardi tweeted something yesterday - February high amplitude phase 8 was rare in the record. That made me have a look at the years and do my own composites. The years are 2001 - 1999 - 1990 and 1988.
I've include 2008 as the CHI progression was much higher amplitude than the OLR one - not sure if that makes an overall difference.
The composite reanalysis of the five years for February and March.
Composites, by their nature, are a blend of the years involved but could there be a clue in the above as to what to expect in a few weeks time.
https://www.esrl.noaa.gov/psd/cgi-bin/data/composites/printpage.pl
https://www.esrl.noaa.gov/psd/data/climateindices/index.html
-
8
-
-
This thread is looking rather lonely and the other one, I hope, has reached its nadir today.
People are fretting about the Scandinavian block sinking but have they really looked at why that is being modelled. An animation...
Where's the Atlantic in the picture?
It is not sinking because of a raging Atlantic jet stream riding over the top - it is being sunk by a huge chunk of Siberian vortex putting pressure on it! What happens when you sit on a big round beanbag; it squishes out to the sides ...on one side is Greenland.
As @MattHugo says in the model thread, give it time and have a bit of patience.
-
9
-
-
- Popular Post
- Popular Post
23 minutes ago, northwestsnow said:Just a snippet but tomasz on the beeb just now talking of cold easterlies setting in and i quote ' lasting well into next week'.I know that probably doesnt tie in with the NWP this evening but thought i would mention it.edit the latest forecast mentions yorkshire, NE England and E Scotland.
Even the GFS has easterly winds over the UK till late next week and with the forecast windchill
- it will feel very cold to the bulk of the population watching his forecast.http://www.meteociel.fr/modeles/gfs/royaume-uni/vent-moyen/3h.htm
http://www.meteociel.fr/modeles/gfs/royaume-uni/windchill/3h.htm
-
10
-
13 minutes ago, johnholmes said:
If you wish to chat then please pm me rather than in the model thread, happy to do that to try and explain
Would that not be a perfect opportunity to use the new 'slower' model thread. I'm sure many of us would like to read the explanation and reap the benefit of all your years of experience.
There are statistics for Europe - the WMO collate them but only update monthly.
@johnholmes link for WMO verification.
-
4
-
-
- Popular Post
- Popular Post
Psssstt......
The daily ECM 00Z may not have been great but the monthly run from same time frame comes up with goodies.
-
17
-
- Popular Post
- Popular Post
Surely Ian Fergusson is talking about the upper cold pool needed for instability for convective shower development. That has certainly been reduced and moved south in comparison to the midnight run.
00Z
12Z Fiddling with reverse on the ARPEGE.
http://www.meteociel.fr/modeles/arpegee_cartes.php
There's enough dubiety and options to make dissection useless at this point in time.
-
13
-
- Popular Post
- Popular Post
Since there is a lull between model runs, let's take the link for the UKMO 168 hour forecast and use it for what it is designed for - ie tropical weather forecasting.
The three main models at the day seven period. You may wonder why I'm using a southern hemisphere view - it is best for looking at the broader picture MJO as it spans the equator.
GFS
UKMO ECM
That all looks in good agreement - there's a function, top left, (pink strip right above chart) for looping comparison of the models for each day of forecast; very useful!
Anybody spot some tropical situation for ECM to be out of step?
https://ruc.noaa.gov/hfip/tcgen/
For people new to this, Adrian Matthews offers simple to understand discussion and animations of how the atmosphere responds.
http://envam1.env.uea.ac.uk/mjo.html
On the subject of what interactions are taking place above the North sea and the land mass of the east coast - try using the vertical atmosphere forecast from the GFS. Main page for making your own cut.
http://www.meteociel.fr/modeles/coupes_gfs.php
I've done one from Lincolnshire out into the sea to let you use the parameters without fiddling about.
-
14
-
- Popular Post
- Popular Post
27 minutes ago, nick sussex said:The GFS and ECM are on different planets today. The ECM seems to want to leave the PV over Greenland and the GFS removing this and developing some retrogression. If the MJO is the key driver then the GFS is correct as its evolution and what its been trying to do ties in with the progression of that signal. It could be that we're seeing different views of the PV in terms of re-location after the strat warming but its very unusual to see such vast differences in terms of strat response.
The MJO today on the Macritchie forecast remains rock solid on progression to phase 7 and 8 , so with conditions now helping that signal to impact the NH pattern I'd continue to be dubious of the ECM.
The BBC weather men talking as if this is a key ingredient.
-
24
-
- Popular Post
- Popular Post
29 minutes ago, karyo said:The 12z GFS is beautifully blocked and cold throughout FI and absolutely stunning stratospherically with a perfect split vortex!
Oh yes indeed!
I bet there are few examples of that in the archives - stunning wedges of heights over both ends of the axis - that split should last a while.
-
24
-
1 hour ago, Northernlights said:
A question for the more knowledgeable on here just had peek on the model thread and saw where one chart for the 13th of February had -8 850 air heading east over the mid north Atlantic meeting -8 850 air coming in from the east so it would appear that we cannot escape cold air from either direction. Has this happened at lot in the past or is it fairly rare?
I would think it is fairly rare.
Working purely from stratosphere profile analogues, takes me to February 1991 and March 2013 for similar 850 temperatures.
1991
2013On the ERA link you can view a variety of parameters at six hourly time steps in the format of a model run. Goes back to 1979.
-
5
-
-
18 minutes ago, Nick F said:
Depends what model and time frames you look at, winds seem to swing between easterly and southeasterly, don't be fooled by the pressure contours, as winds tend not to always blow parrallel to them either.
Either way, both cold directions - SEly has advantage of shorter sea track if near continent is cold, though greater risk of less cold air mixing in from S Europe.
But it's also looking dry from either direction bar some flurries, without deep cold pool moving west or Atlantic fronts pushing up against the cold and dry air.
Yes, 144 hours on latest run ..
wind direction and thetaE for same timeframe.
There will be a raw windchill at the surface but it doesn't produce the goods that people are looking for.
-
2
-
-
1 hour ago, damianslaw said:
Was there a SSW late Jan 1991 - if so then it was a very quick response with the cold in very early Feb, it didn't last too long though, 2 weeks at best, remainder of Feb 91 was mild and March 91 not especially cold at all.
No technical SSW in 1991 but this year following a very similar script as @bobbydog has been commenting on in the model thread.
Strong warming end of January '91
(Note core cold centred to north of UK as was the case last week.)
The vortex partly splits into two lobes and is rapidly followed by development of Scandinavian high pressure. I cannot see if this is up or down influence as no archive of the different levels from back then. The vortex reformed by mid month and allowed the Atlantic train back on the tracks.
Looking at the GFS strat forecast and reading between the lines of a Fergieweather tweet about GloSea - a proper and lasting split may follow this one but as to what the surface conditions would be to see out February and usher in Spring ..... We know a cold March can follow a decent split from the events of 2013 but the picture is far from the scattered vortex profile that was present at this stage in 2013.
An edit to add the archived MJO chart from February 1991 - similar phasing to current forecast but a much lower amplitude.
-
4
-
-
- Popular Post
- Popular Post
This will please those who were looking at comparisons with 1991 - similar distribution of the separate lobes and a proper split this time.
06Z
1991 -
12
-
No wonder there is a red warning out for wind - this is the forecast mean 2 metre wind speeds.
-
1
-


 Feb '88


 - it will feel very cold to the bulk of the population watching his forecast.
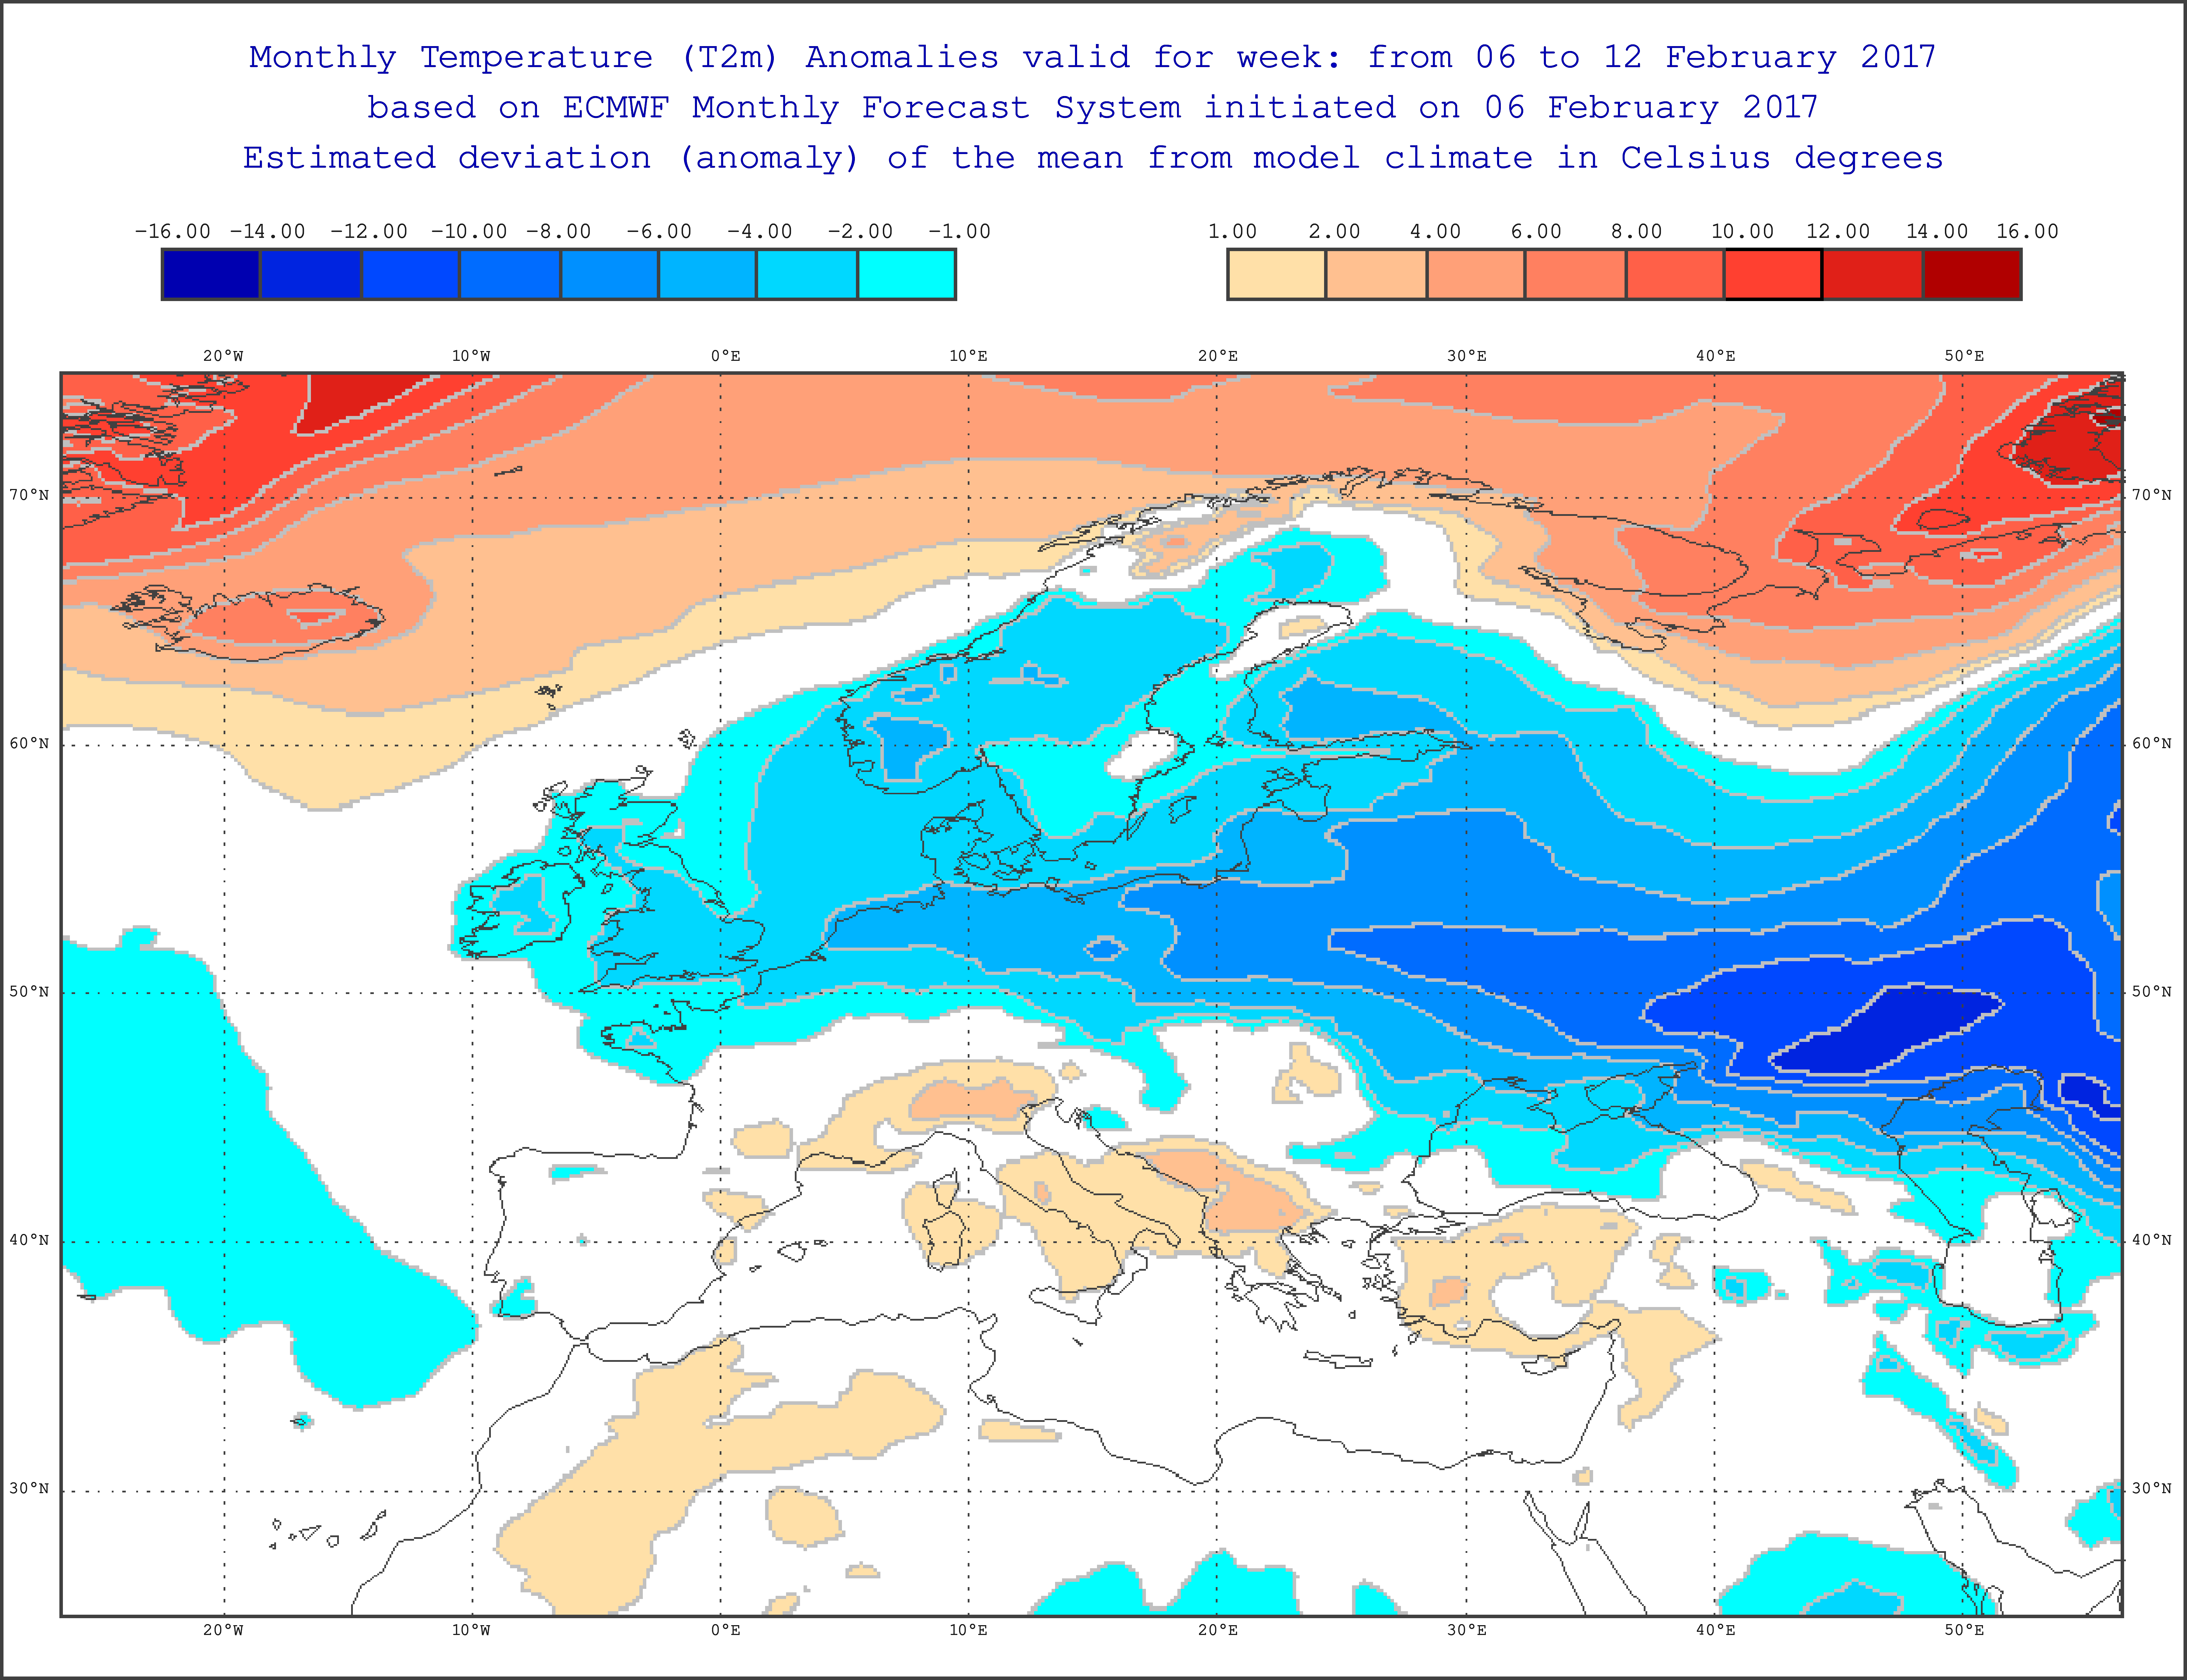
 12Z
12Z 

 2013
2013


 1991
1991 


New Research
in Climate Change
Posted
I've already posted some of the interesting results from the European SWARM satellite but this is really intriguing in light of some research that links solar core magnetism to that of the core of earth.
A jet stream accelerating at high speed, in high latitudes, deep in earth's core - could this have any implication on the surface patterns?
Hopefully the courtesy link to full article works - it looks rather long.
http://www.nature.com/articles/ngeo2859.epdf?referrer_access_token=5mBZ_WSWTB7UhGSeCnNSItRgN0jAjWel9jnR3ZoTv0PmsEc3G31WFfVT1PriGtJTaR0HLPfAWbii_7PtlU1mK7i05sQIIH1nSzUJZB1m_vk9uJQKnYUCPnpl0urzXsKW_ytxvFrbabjaBglf7nUGEQ5-jXvyVihVn2iAaocIiKbGCX3Ocg0snCWB7QS43VpOr0ydw6nH8yn6Im2tiC-Q8Q%3D%3D&tracking_referrer=www.bbc.com