


Gael_Force
-
Posts
2,425 -
Joined
-
Days Won
2
Content Type
Forums
Blogs
Gallery
Events
Learn About Weather and Meteorology
Community guides
Posts posted by Gael_Force
-
-
5 minutes ago, Addicks Fan 1981 said:
Think @razorgrainthat the AMOC collapse isn't likely in spite of what the media have suggested. The media to us are basically toying with all sorts of possibilities.
It is NOT the media suggesting anything. They are reporting on scientific studies with a good dash of hyperbole for headline impact !!
-
 2
2
-
-
29 minutes ago, mushymanrob said:
I can find no correlation between solar maximums/minimums and cold/mild winters or warm/wet summers
I don't think there is any correlation other than a propensity for more meridional patterns in low geomagnetic periods. It will depend where we are positioned in the wave pattern when it gets stuck. Not sure where we are in the solar cycle but the early upslope is usually when these conditions are most likely.
-
 1
1
-
-
15 minutes ago, CoventryWeather said:
Is there a chart like this that shows the average sea level pressure over those three months.? Personally see plumes associated with this.

The first image is multi-model for sea level pressure. As you can see, no detail as is to be expected; better to use heights as a very rough guide.
all other parameters here:-
Meteociel - Modèles de prévisions saisonnières de 1 à 6 mois de Copernicus C3S
WWW.METEOCIEL.FRMeteociel propose les différents modèles de prévisions saisonnières mensuelles de ECMWF, Meteo-France, UKMO, NCEP, DWD, CMC, ECCC et JMA-
2
-
-
A master of camouflage in the birch tree twigs !!
Buff-tip
BUTTERFLY-CONSERVATION.ORGWhen at rest, the wings are held almost vertically against the body with two buff areas at the front of the thorax and at the tips of the forewings which look very like the pale wood of the birch. The rest of the...-
2
-
-
5 minutes ago, sebastiaan1973 said:
It's quite logical, because GFS shows no downwelling into the troposphere. That's one of the problems.

I have in memory a recent SSW that did not downwell at the time but it did have an effect on early Spring. Anybody remember which year that was?
-
6 minutes ago, YellowSnow said:
And perhaps that’s why the misleading over enthusiastic posts need to be curbed, so that the crushing disappointment is avoided or at least diminished.
The easiest and quickest way to do that is to remove the like buttons.
-
1
-
-
41 minutes ago, feb1991blizzard said:
Really not sure how someone can say the GFS trop model and strat model are different, they are not, they are all one model which runs based on laws of physics, its just the boundary layer moves up and down in altitude with different thicknesses, its still all modelled together.
Yes, I'm amazed at the reaction to that inaccuracy.
Some models with more layers may be better able to create continuity/accuracy through the levels but to claim they are two separately modelled entities is just plain wrong.
-
1
-
-
Is there such a thing as a displacement split?
-
1
-
-
- Popular Post
6 minutes ago, Sheldon Cooper said:Runs have been showing Scattered Snow for most of the next few Weeks how would we read that off Models and what seperates
this
From this
In the first one you see the Jet Stream is showing the air coming down from the Arctic called an Upper and will bring Polar Air Along With it.
In the 2nd one you can see the Jet Stream bringing Air from the Atlantic this Air is bringing mild unstable air(Low's don't have to be Cold more bring Rain and are unstable) this is called a Returning Polar Maritime Air parcel. The 2nd Low will bring Unstable Air and more Connectiveness in this you can have Thunders now when this Mild Air Goes Below 0oc.
How do you Interpret These charts.
Such as the 2st one an Arctic Northernly will bring Cold Air and Polar Air Parcels which will most likely bring below 0oc Air In Winter and Snow which will be Wider And Longer lasting. It is important to note that we can get Air from Scandanavia called a Beast From The East which isn't garuanteed but will most likely bring Showery Snow 2018 was an Example Of this. A high in Winter coming up from Europe US Called An Azores High and brings Tropical Maritime Air Which Is Humid And Mild And This Will Bring 10oc And Above Most likely.
Todays snow satellite illustrates your point well. Big beefy snow showers (red tinge) as the arctic parcel comes south.
-
8
-
3
-
21 minutes ago, Daniel* said:
I thought it was posted? But there’s definitely a suggestion of cold continental influence over northerly, so perhaps turning very cold into early January. ECM op had this too at day 10, but seemingly too flat with ridge.
15 day meteogram for Nottingham, strong signal for northerly wind day 9 to 11.
-
1
-
-
9 minutes ago, Blizzard_of_Oz said:
The lack of manual data input into the models due to the holidays is correct, this also happened in 2010, those of us that have been on this forum may remember the same debate back then.
Another 48 hours and I’m confident we will see a different output.The only issue I'm aware of is lack of flight data on a day or two over the holidays. Flight data must have been reduced/impacted all through this strange year; has it made a difference to the accuracy statistics?
-
1
-
-
Did someone mention insular
Cannot remember ever seeing such a perfect bullseye of low heights centred on the BI
Just realised that the ECM charts are clickable for meteograms.
ECMWF | Charts
APPS.ECMWF.INT-
1
-
1
-
-
4 minutes ago, Weathizard said:
It’s my one criticism of Meteociel is that they don’t have a side by side comparison viewer like the netweather GFS charts does.
Meteociel has a whole panel of charts to compare, you just need to click on voir panel multimodeles.
-
2
-
1
-
-
Day 10 http://brunnur.vedur.is/kort/ec-ens/2020/12/23/00/ec-ens_nat_z500scenarios_2020122300_240.png
Day 15 http://brunnur.vedur.is/kort/ec-ens/2020/12/23/00/ec-ens_nat_z500scenarios_2020122300_360.png
Scenarios we would have given our eye teeth for in years past. The strength and longevity of the Greenland heights anomaly.
-
8
-
1
-
-
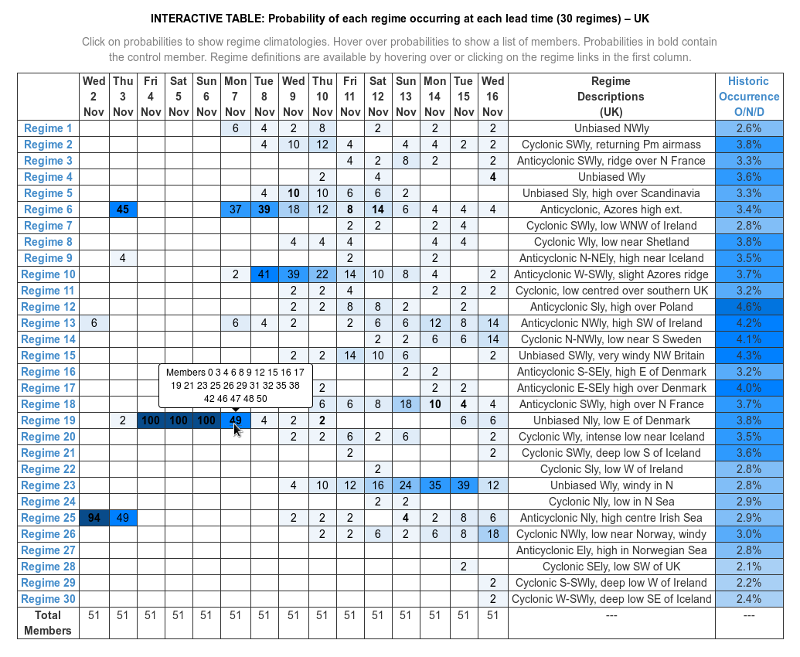
3 minutes ago, CreweCold said:
Regime 25/30 it says at the top. Looks like a climatological still IMO. I.e a synoptic example of a pattern with mean temperature deviation attached.
Looks like it is from the DECIDER charts.
Decider
WWW.METOFFICE.GOV.UKChoose Decider to give fast advice to forecasting teams or traders working in weather-sensitive trades.-
2
-
-
11 hours ago, Catacol said:
What can still vary is the intensity. The current warming happening right now was slightly undermodelled up until this weekend. This is why SSWs can be so hard to predict - the pattern is clear from distance but not the intensity nor the precise angle of attack which is very difficult to work out. Wave 1 warming on the ECM yesterday hardly fades at all right out to day 10 and is more intense over the next 5 days than previously forecast. It will be interesting once we get to day 8 when wave 2 pinching begins to fade away to see just how much this attack has taken out of the vortex. This is all good news.....but we really really want a split. A wave 1 driven ssw could deliver cold...BUT all too often the direction of attack forces the displaced vortex over to the Atlantic sector and that just pumps up our jet.
Actually I’m interested now to know if any past wave 1 SSWs have originated from this side of the globe and shoved the vortex over to Alaska. @chionomaniac - is there an archive of vortex shapes for past SSWs freely available anywhere?
If you know the years and dates, the Japanese site has 5 day means for 30, 100 and 500 heights.
-
1
-
2
-
-
18 minutes ago, E17boy said:
We must ensure all logistical transport routes are clear from Siberia and Iceland so that Mr East and Mr North can access the uk easily. Brecht should not cause any delay.
Brecht (sic) ... perfect timing for the Beast to put in an appearance. No science, no teleconnections no gut feeling, just the simple law of Sod. The east wind is probably the only visitor that can have unfettered access to the UK.
-
3
-
-
1 hour ago, sebastiaan1973 said:
By Antony Masiello
Currently closely tracking 1995 and 2007 .... both years just before solar minimum was called. Who can forget December 1995 but 2007 was unremarkable. Nothing to be gleaned from that but the law of Sod dictates there will likely be some sort of beastly intervention when services are stretched owing to other pressures.
-
20 minutes ago, Kirkcaldy Weather said:
On such charts, the concept of the OPI was born.
A snapshot of 2010 with other dates and level data here.
-
1
-
-
4 minutes ago, Katrine Basso said:
AURORAS WITHOUT A SOLAR STORM: Yesterday, there was no solar flare, no coronal mass ejection (CME), no solar activity of any kind. Then this happened:
Is there a link to go with image? Wondering if they give a reason for it.
-
1
-
-
1 hour ago, West is Best said:
A gust of 130 kph, 81 mph, just now at Belle-Ile
Gust 186 kph registered at last reading.
-
1
-
-
I don't remember seeing anything similar to the modelling of Alex. Is it because the tiny surface feature gets trapped under the cut off upper low that causes it to do a loop while remaining intact?
-
32 minutes ago, bluearmy said:
Can anyone summarise exactly what will become freely available ? Can’t believe that the data which currently costs in excess of 100k per annum will suddenly become gratis !
It seems so.
QuoteEarly October will see the European Centre for Medium-Range Weather Forecasts (ECMWF) take a major step towards making hundreds of its forecast maps free and available to all. The changes are part of wider moves across Europe to make public sector data free and open, to encourage innovation and to support a thriving, data-based digital economy.
Charts will cover the whole world, all types of weather situations including extreme events, and, very importantly, will also include probability-based information, providing guidance on forecast confidence.
Up till now, full access to these forecast charts was restricted to the national meteorological and hydrological services of ECMWF’s Member and Co-operating States, World Meteorological Organisation members and commercial customers. Access was subject to a range of bespoke licences and often incurred charges.
https://www.theparliamentmagazine.eu/news/article/towards-free-and-open-weather-data-for-all
-
2
-
-
Big waves with this.
-
2
-


Model Output Discussion - Mid Summer Onwards
in Forecast Model Discussion
Posted
I was musing these patterns.....
SSW Canadian warming in November/December is associated with a later winter Scandinavian high. We had a very strong mid March warming which was in focused in that region. Have we been seeing the synoptics of an epic winter, play out in late Spring and early summer?