


SqueakheartLW
-
Posts
1,403 -
Joined
-
Last visited
Content Type
Forums
Blogs
Gallery
Events
Learn About Weather and Meteorology
Community guides
Posts posted by SqueakheartLW
-
-
24 minutes ago, Weather Enthusiast91 said:
Can't believe people are giving up on winter already when we are only just out of summer. This must be a record for the earliest "winter is over" posts yet.

The first one was I think on the 1st or 2nd. I replied to it and it should be in my comment history
LOL. It's so funny when they do it on the first day of September.
Wonder when we'll have "winter is over" posts in August?
-
16 hours ago, Don said:
Indeed, await Glosea update now with bated breath and need this exceptional heat to do one asap, but the breakdown looks to be put back as I feared, followed a resurgence of high pressure again!
Not looking good if this warm September / mild winter theory holds true yet again but imagine the irony if this very warm start to the month results in our first ever 17C CET September or even the possible chance that September ends up warmer than June 2023 and ends up the warmest month of 2023.
-
 1
1
-
-
12 minutes ago, Uncertainty said:

This is really something now. What a signal we have. As @northwestsnow has alluded to the ecm has quadrupled down on its major -NAO / euro trough combo. I’ve said it before and I’ll say it again. This is the strongest, most consistent signal for a cold winter pattern I’ve seen since 2010. Not sure why so many people come on to this thread to say long Range forecasting is pointless. It’s low skill yes but a signal is a signal and this one is strong.
Like that deep blue over the NE Pacific. Makes a change to the dreaded red blob we have got used to seeing on the winter output.
The -NAO signature looks good here and at least it looks like it isn't west based.
Its also clear to see the EP El Nino signature here with the blues in the eastern tropical Pacific and the oranges over the western Pacific and Indonesia.
-
 3
3
-
-
20 minutes ago, Sunny76 said:
Nobody will know for sure. It’s too far away at the moment.
For me, I usually find November is a good period of gaging what might transpire between December and February.
That said, it’s usually mid December when I feel a pattern usually sets in to either mild or cold, and remains so( with a few interludes) until winter is out.
I would agree with this one. Anything before mid December is usually a continuation of the late autumn pattern and if this contained northerlies or easterlies then you might get an early taste of cold in early December.
2021 is a good example with that very early December northerly snap but that was as good as we got and the rest of the winter was mild. 2010 is the most extreme recent example of cold late autumn which on this occasion went right through to after Christmas. The true pattern of the winter finally set in into 2011.
2000 and 2009 were examples of the opposite with the mild theme from autumn continuing on into December before around mid month the true pattern of each winter emerging. 2000/01 went on to be on the slightly colder side of average with several colder spells with average or above average periods between them. 2009/10 was a colder version of 2000/01 but surprisingly for me I saw more snow from 2000/01 than 2009/10 despite the latter being a colder winter.
-
2
-
-
5 hours ago, CreweCold said:
Hey CFS paint us the worst possible picture for December
CFS: 'Right on it boss'
Yeah, errr, please don't actually do that...
Hopefully we see these charts flip 180 over the next few weeks...
BIN IT
LOL
Its the CFS after all
5 hours ago, jules216 said:Uncanny as I was doing my analogs other day it looks almost identical.
Not looking as good as it did but we still have time for things to change yet
-
You know when the real countdown to winter begins when you see the winter updates from Gav starting up
-
8
-
-
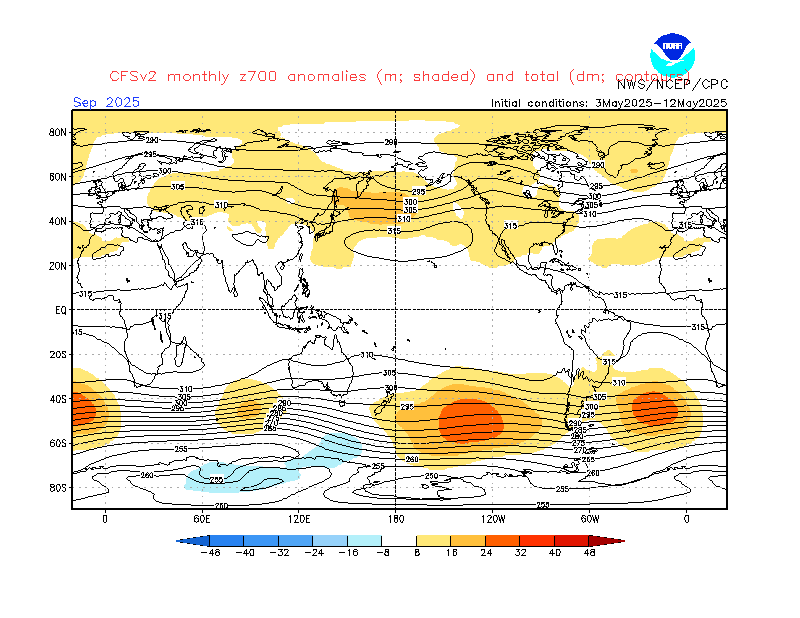
1 hour ago, RainAllNight said:
Z500 rather than MSLP, but here you go:
............
What's fascinating and frustrating is that you can see how close the models got at times to predicting the correct blocking pattern... but just small differences between the predictions and reality meant a completely different kind of outcome for us.
What would be of interest is how this anomaly chart compares with summer 2009
-
6 hours ago, CreweCold said:
Love some of the crazy charts that the CFS is pumping out for February, not bone chillingly cold but very very wintry in their own right with such low thicknesses
Think we already know that nothing on the CFS ever verifies
LOL

-
On 01/09/2023 at 17:42, summer blizzard said:
Rolling CET for September-August fell to 10.76C.
A relatively modest bar to exceed from September 2022 so I wouldn't be too surprised to see this value rise again next month
-
2 hours ago, Beanz said:
Winters over?
Oh look, our first "winters over" comment at the start of September
LOL
-
We can blame the warm to hot start predicted to September on this ex hurricane merging with the trough to our west and pulling the low near Portugal north turning our winds into the south and giving us the very warm to hot start.
Just think if this one ex hurricane is all it takes to give us a warm September and the chance that winter will be off already, surely not something else to ruin winter
-
9 minutes ago, CreweCold said:
It worries me because the CFS usually throws out dream charts at such long range...but they are hard to come by at the moment. If the CFS can't even throw out decent runs then maybe we really aren't in a great place lol.
Maybe the CFS doing the opposite means this time around the dream charts will arrive come December when we want to see them
-
4
-
-
11 minutes ago, Don said:
Oi you, I said last weekend it would be your fault if the ECM was onto something more summer like as we moved into September!! Now what have you got to say for yourself?!

LOL


We do indeed wait with abated breath from @blizzard81 don't we?
-
1
-
1
-
-
9 hours ago, damianslaw said:
Derailing the thread by focusing on winter 09-10 apologise, 09-10 saw coldest snowiest conditions more in the north, whereas Late Nov - Dec 10 brought snowiest conditions to the east, hence varied perspectives.
Dec 09 was far snowier here than Dec 10, though the cold only arrived mid month. It started mild and there was no sign of it turning cold, but suddenly around 9th, high pressure ridged in from the azores and through the UK strengthening in situ and became a block. A highly unusual synoptical evolution.
You would never have thought that the cold was about to strike looking at these charts from 5th to 9th December 2009
All looks like locked in zonal and SW winds here and at this point it looks like December 2009 is written off for cold.
Then the first and important change shows itself between 10th and 12th December 2009
We start to see the first important change here with the cold uppers moving across the continent ready for what is about to happen.
Between 13th and 16th December 2009 we see the high start to pull further to our north ready to unleash the cold onto the UK
All the while this is happening even colder uppers are pushing in from the east ready to be unleashed on the 17th onwards.
The rest of the month is basically colder than average after this with an Arctic shot before Christmas before the coldest weather early in the new year.
-
4
-
 3
3
-
-
17 minutes ago, Frigid said:
SLAP BANG! Greenland covered in heights, you love to see it. Coldest winter since 1963?.. I think we're due it
Now, back to reality. Honestly a 2009/10 would be incredible, would follow the trend of a remarkably similar July-August period we've seen this year compared to 2009. Of course, gotta take these charts with a pinch of salt. That low could be a bit more south, but at this stage it's looking good.
I wouldn't totally rule out a cold or very cold winter. They appear to occur approximately 60 to 65 years apart or thereabouts.
This winter will be 61 years since 1962/63 so very much in the perfect range for a cold or very cold winter.
Cold or very cold winters
Winter December CET (Anom) January CET (Anom) February CET (Anom)
1697/98 2.50C (-1.50C) 0.00C (-2.41C) 0.50C (-2.46C)
1765/66 1.70C (-2.22C) 0.70C (-1.67C) 1.70C (-1.96C)
1837/38 5.30C (+0.84C) -1.50C (-4.11C) 0.40C (-3.54C)
1894/95 5.10C (+1.13C) 0.20C (-3.29C) -1.80C (-5.68C)
1962/63 1.80C (-2.92C) -2.10C (-5.66C) -0.70C (-4.40C)
2023/24 ?????
Cold Decembers
I've also noticed a 60 year pattern for very cold Decembers
1830 1.80C (-2.21C)
1890 -0.80C (-4.48C)
1950 1.20C (-3.66C)
2010 -0.70C (-5.67C)
-
1
-
5
-
-
3 minutes ago, damianslaw said:
Well the similiarities with July and August 2009 and 2023 are quite remarkable, and how Sept 23 is starting.. the 2009 trend continues.
Wait for the 2009 trend to break come mid December 2023 LOL
-
Wonder if we are due a September 2009 repeat. Seems coincidental that an area of high pressure is moving in over the top of the UK just in time for the start of the month and as we know September 2009 was high pressure dominated with next to no rain over most of the UK for that entire month.
Maybe getting my hopes up too much here for another 2009/10 redux, only as long as we don't see a November 2009 repeat, what a washout that was.
-
2
-
-
15 hours ago, Summer of 95 said:
Not much in December 2000, 2-3cm but that was the most since January 1997 (and the first time it had stayed on the ground more than 24 hours since then).
Dec 2010 we had snow on the ground from Nov 27 to Dec 9th, then again from 17th to 28th. Maximum was 15cm from 22nd-26th Dec (7cm on 2nd-3rd in the first spell). That one certainly made up for the winter before.....
2009/10 was the horror show when a 20-30 mile radius of Shrewsbury somehow avoided virtually all the snow time and time again. Whatever the wind direction, whatever the forecast... And again and again. Rather see another 2013-14 than that one (everywhere had nothing in that one)
The late 1990's and early 2000's winters were a bit hit and miss and generally quite localised in who did well out of them. As for my location:
1997/98 - Apart from the brief transitional snow event mid December 1997 the rest of this winter was poor for snow except for January 19th with a northerly toppler that gave some snow showers. April 1998 was also good around Easter.
1998/99 - Although a milder than average winter it was actually quite good for snow in my location with at least 5 separate snow events or showers and in general Scotland and areas of England bordering the east coast did quite well off the various Arctic northerlies that winter.
1999/00 - Probably the worst of the late 1990's / early 2000's winters for my location. Saw even less snow than in either 1997/98 and 2001/02. What little snow I saw was all between 13th and 21st December 1999.
2000/01 - For me this was the snowiest of the late 1990's / early 2000's winters. The Christmas to New Year cold spell was the best one of the winter with the late Feb / early March one a close 2nd. Did better off the late December 2000 cold spell compared with the late December 2001 one.
2001/02 - A winter that could have been better. Only late December 2001 was any good for snow. The 22nd and 30th December were the 2 main snow days in my location. Another very brief band of snow paid a visit late in Feb 2002.
2002/03 - Better than 2001/02 and 2003/04 for snow but generally focused on early and late Jan 2003 as well as early Feb 2003. The late Jan 2003 northerly toppler gave quite a covering of snow in my location.
2003/04 - This was a winter which in my opinion was a let down when the cold shots arrived. Got very little off the December northerly or the February one. The January one was better and this winter did manage to give me falling snow in December through to March too.
Rating the above for me from best to worst for snow
- 2000/01
- 1998/99
- 2002/03
- 2003/04
- 2001/02
- 1997/98
- 1999/00
2008/09 to 2010/11
As for this trio of colder winters the single biggest dump of snow in my location came from a convergence zone overnight 30th November to 1st December 2010 with over 40cm of snow which added to existing cover from 25th November 2010 which then stuck around right until early January 2011.
Didn't do badly from January 2010 event either with over 5cm of snow that stuck around for over a week. December 2009 was a let down however with all the snow both to our north and south with my location in sunshine.
February 2009 wasn't too bad either with my location on the colder side of several frontal events that pushed northwards into the colder air.
I would however rate all 3 of these winters more highly than any of the late 1990's to early 2000's winters.
-
1
-
On 26/08/2023 at 14:05, Don said:
I'm happy to donate my fan lol!
Apparently the IOD is very positive at the moment, which also needs to be taken into account, as very positive IOD's are not good for a cold winter in this part of the world. We need to hope this moves back to less positive, neutral or negative for winter.
Hope it isn't as positive as 2019. Maybe we can get away with it if it isn't too positive.
2023
2019
Looks more positive at this stage in 2019 to me.
-
1
-
-
September 2015 was colder than average and we all know what happened when December arrived
MILDEST DECEMBER ON RECORD BY A BIG MARGIN
-
2
-
-
Just now, Don said:
Well, it's just gonna have to unstick to its guns innit and if it doesn't, then that's your fault!

Remember the important months are in the winter. We can have a mild autumn then a cold winter. Didn't 2005 have a mild autumn followed by a colder than average winter?
-
1
-
-
1 hour ago, Mike Poole said:
I take it by a ‘classic’ winter you mean the usual dross?!
It’s an interesting question, and my answer probably isn’t quite what you’d think. GW is making things more unpredictable, but I think there is a tendency in global weather patterns for them to become more ‘stuck’ - generally, I mean, not related to winter particularly. Eventually, that’s going to mean the UK gets stuck on the cold side of the jet stream in winter. So while the general trend might be a warming one, and that probably does mean on average winters will continue to be milder, there might be an increase in more significant colder spells also. We haven’t seen much evidence of this at all recently, of course, but I’m thinking the likes of Dec 2010, and March 2018.
But in one respect, I agree with @CryoraptorA303 above - I also think coldies have been unlucky in the last decade, I’d add failure to get other drivers to go in our favour at all during the last solar minimum to the list of unlucky shots.
But the question is have we been unluckier than the GW regime is solely responsible for? My hunch is yes, so I expect some ‘regression to the mean’ in the next decade. Against that, my main worry is the QBO, if we continue to not get our fair share of east QBO setups, then that in particular could tip the balance very much away from cold.
This year - there is no past analogue for the state of the atmosphere and oceans. So will it result in a UK cold winter or mild winter? Who knows? The models sniff cold, but that could easily change. If they persist in showing cold, maybe we’re in with a shout…
Historically in regards to solar min the even to odd cycle minimum is not great for coldies but the odd to even one is quite good.
Think of how the coldest winters are typically around 22 years apart and tend to mostly cluster in the descending odd and ascending even parts of the cycle with around and just after the odd to even minimum the greatest chance of cold.
Descending Solar Cycle 24 to Ascending Solar Cycle 25 (Even to Odd) - 2014 to now (Min 2019)
Not great for coldies. Minimum year 2019/20 was mild and wet, 2021/22 was mild and 2022/23 was also mild but not as much as 2021/22. Only 2020/21 was close to anything resembling cold at times and December 2022 to an extent as well
Descending Solar Cycle 23 to Ascending Solar Cycle 24 (Odd to Even) - 2003 to 2014 (Min 2008)
Winters 2008/09 to 2012/13 - Mostly 2008/09 to 2010/11 as I think the colder winter of 2012/13 was mostly due to the SSW. 2011/12 was the exception here but even that featured some decent cold in early February 2012.
Descending Solar Cycle 22 to Ascending Solar Cycle 23 (Even to Odd) - 1989 to 2003 (Min 1996)
This one was slightly better than the 24 to 25 cycle minimum with 1995/96 the best winter in this minimum period. 1996/97 was good for a time but mostly early in the winter.
Descending Solar Cycle 21 to Ascending Solar Cycle 22 (Odd to Even) - 1979 to 1989 (Min 1986)
A few colder winters all clustered around the period 1984 to 1987 with 1983/84 cold zonality, 1984.85 a classic cold winter, 1985/96 a back loaded cold winter and 1986/87 featuring the very cold January 1987 spell.
Descending Solar Cycle 20 to Ascending Solar Cycle 21 (Even to Odd) - 1968 to 1979 (Min 1976)
Not known for anything spectacularly cold although it does feature a solar max cold winter in 1978/79 which seems unusual.
Descending Solar Cycle 19 to Ascending Solar Cycle 20 (Odd to Even) - 1958 to 1968 (Min 1964)
Some rather cold winters occurred during this particular descending odd/ ascending even phase with the best winter of them all 1962/63 included too.
The pattern appears to continue on into the past as well with the cold 1940's winters also clustering around the same descending odd/ascending even phase again. Even the 1878 to 1880 cold winters were at the start of an even solar cycle 12 too.
-
1
-
4
-
-
Good news for those of us who want to avoid a Super Nino. It would seem CFS have dropped the idea recently.
Early August forecast
Mid August forecast
Most recent forecast
Now if this isn't good news for coldies then what will it take for the pieces to fall right for once.
-
3
-
-
On 23/08/2023 at 15:47, Addicks Fan 1981 said:
The niño regions this week are:
Niño 1 & 2 3.3
Niño 3 2.0
Niño 3.4 1.3
Niño 4 0.9
Still on course for at least a strong event in 3.4 if this continues. Hope we can at least dodge super unless it can turn into a super CP event.
-
1
-


September 2023 C.E.T. and EWP forecast contests
in Spring Weather Discussion
Posted
After just 5 days of the month on the provisional CET September 2023 is already ranking ahead of all of the top 10 Septembers on the CET record between 1772 and 2022 as shown in the table below.
Positive anomalies show 2023 ranking warmer than the year whilst negative ones show 2023 cooler.
As can be seen we are already above all of these Septembers.
Below we have how 2023 is comparing to these top 10 Septembers day by day. The top 5 rows already have the provisional CET values on the left highlighted in yellow. Below this I have included the average GFS, ECM and GEM 2m temp mean mins and maxes averaged for each day across all 3 models and this predicted CET value is a mean of all 3 models put together.
It has predicted a CET mean daily value for today (6th) of 20.1C. I feel this could be a slight underestimate however and the high running means around the 10th to 12th over 20C could end up even higher when we do get to these.
The other notable thing here is how far 2023 is predicted to get ahead of the top 10 Septembers if the models prove correct. However we start falling back towards the top 10 by the 21st but still have a rolling value of 17.710C if these models runs are spot on.